Please ensure Javascript is enabled for purposes of website accessibility Good News on Inflation?
dk
en
institutional
institutional
false
true
Gathering data
Disclaimer Not Available

Good news on inflation?

Good news on inflation?

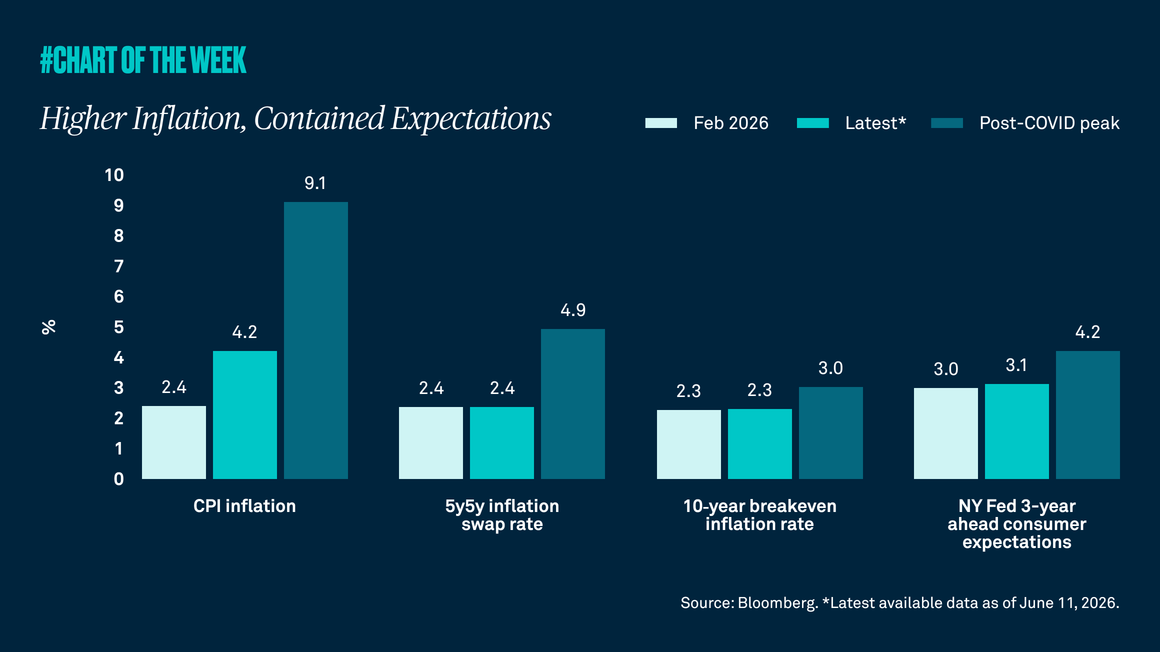
Last week’s Consumer Price Index report, a widely used indicator of inflation in the U.S. economy, showed growth of 3% in September, which was above 2.9% in August but less than expected. Despite the modest increase, various categories have shown signs of stabilization. What does this mean for inflation going forward?

Chart-of-the-week-twentyfour


Last week’s Consumer Price Index (CPI) report, a widely used indicator of inflation in the U.S. economy, showed modest growth from 2.9% on an annual basis in August to 3% in September. Yet, the number came in below analysts’ expectations, helping to allay fears of rising inflation. Consequently, the market ended the week higher.

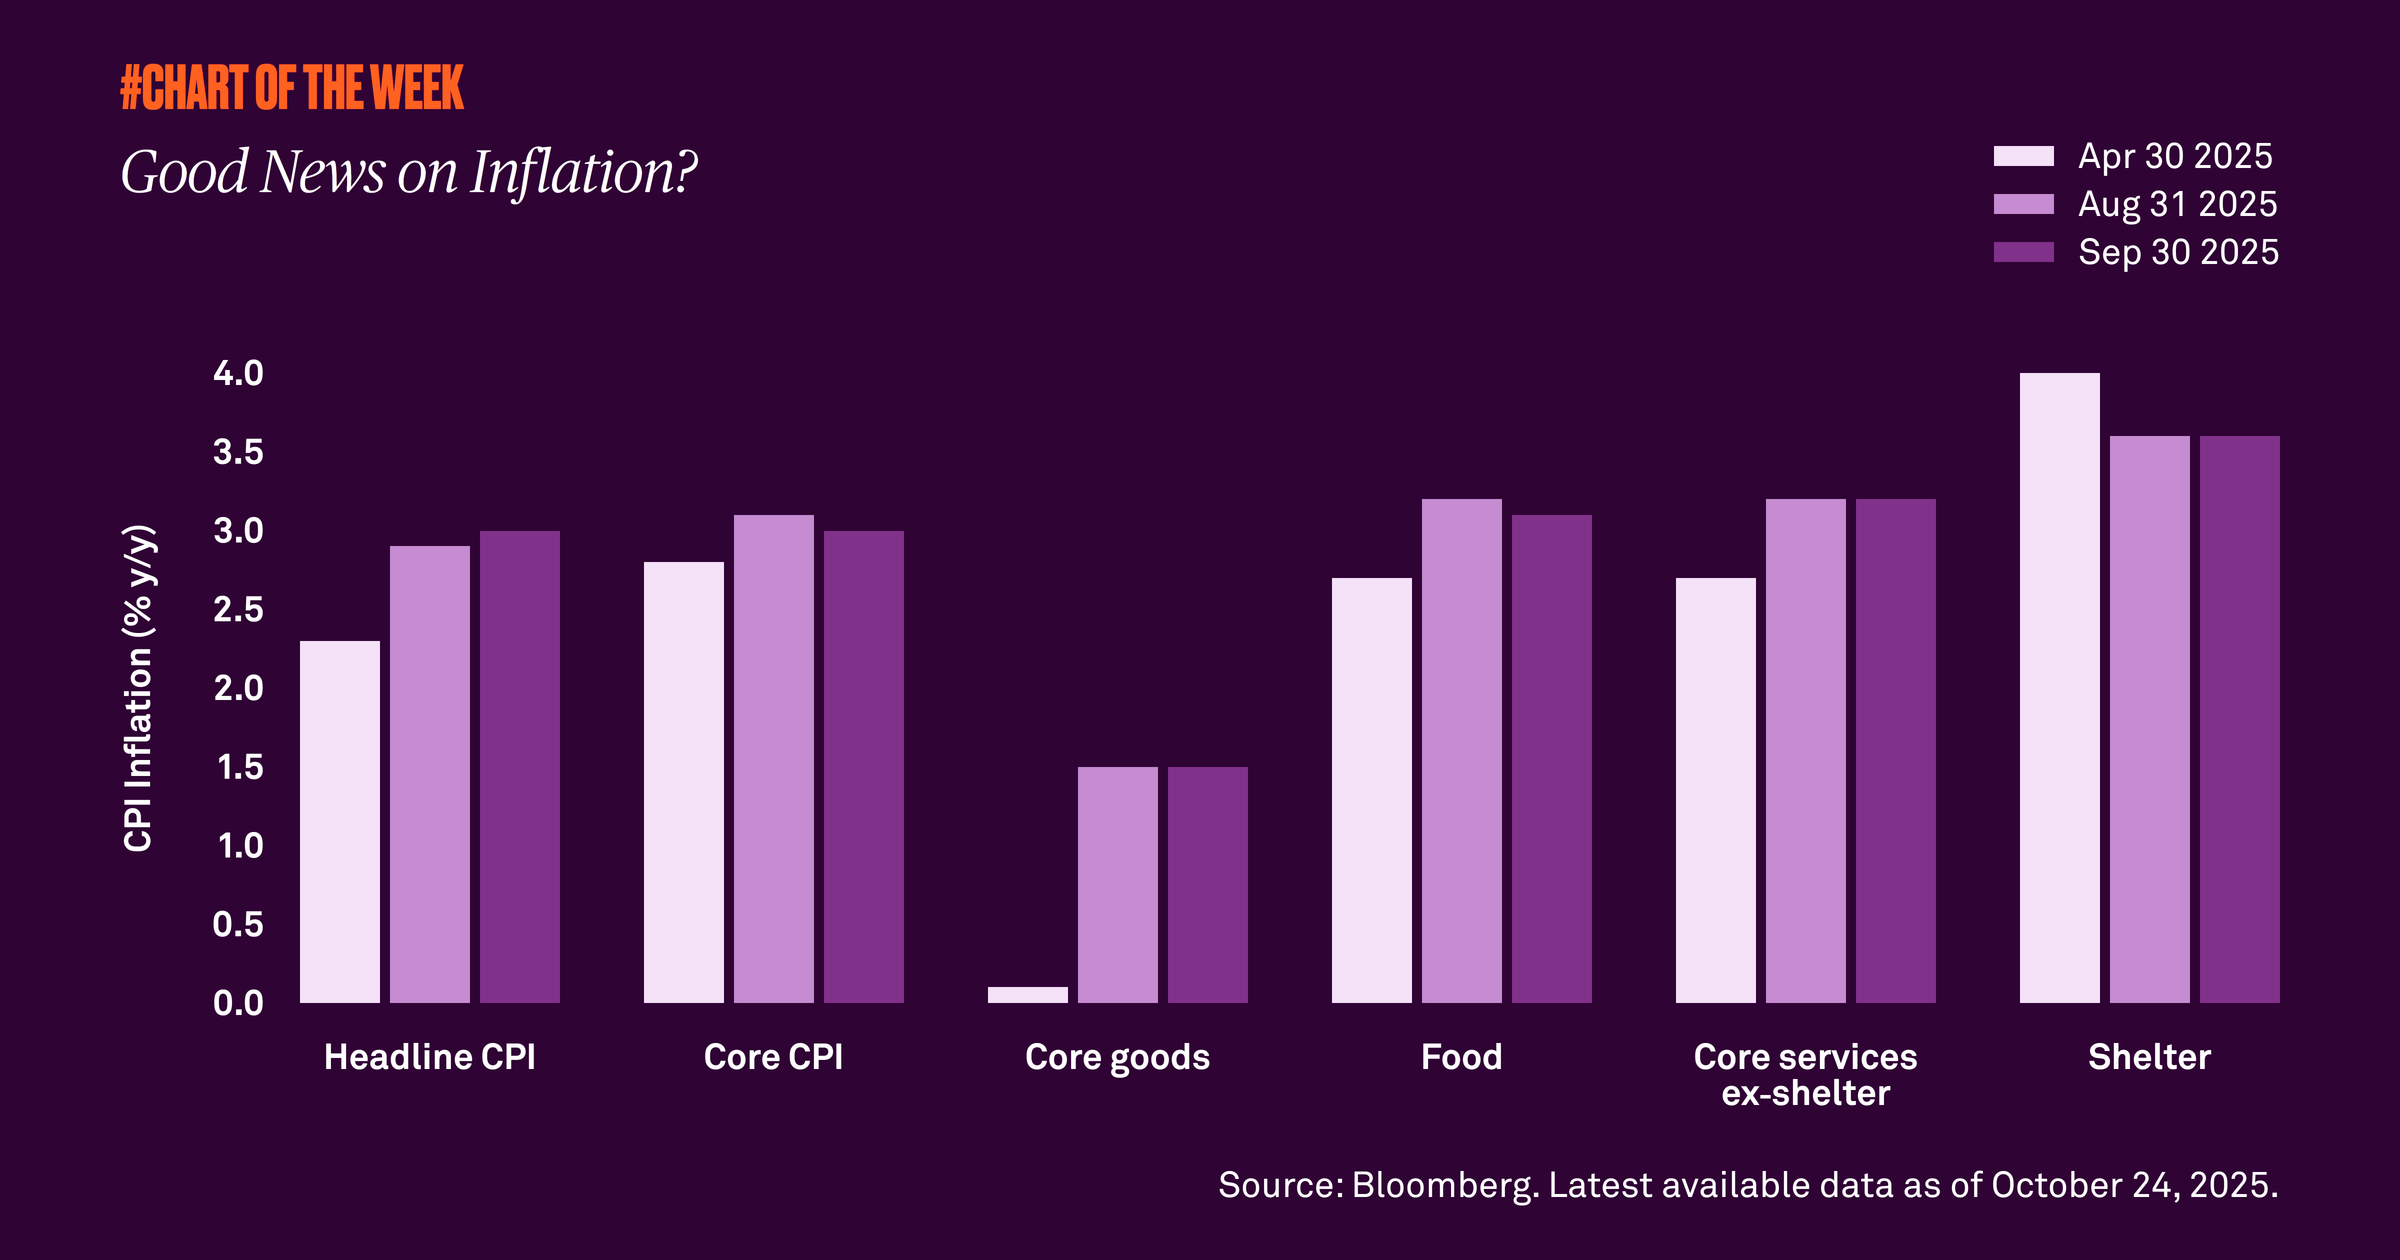
Though the inflation reading was slightly higher than in August, a look at underlying components is encouraging. Core goods, food and core services ex-shelter have risen since April, but appear to have peaked with readings either unchanged or lower in September. Importantly, shelter, which accounts for 35% of CPI, continues to slow, helping to stabilize inflation.

There is the question of what the impact of tariffs will be on inflation once all potential deals are in effect, but we maintain that the result will be a one-time rise in prices rather than a sustained increase. Our view is that inflation will remain within a range of 2.6% to 3.3% through year end. 

RELATED CONTENT
Retail sales remain resilient
Chart of the week | Macroeconomic

Considering the slowing job market, we dove into retail sales data to search for signs of the direction of household spending. We analyzed existing-store sales and found that, despite the softening labor market and concerns about growth, aggregate consumer spending remains resilient.

Bullish on Fed easing?
Chart of the week | Macroeconomic

As expected, the Federal Open Market Committee delivered another 25-basis point rate cut. Investors are now focused on the pace of cuts from here. However, the more important driver of future equity returns is whether the Fed is easing into an economy that is growing or not.

Bubble or is this market different?
Chart of the week | Macroeconomic

The S&P 500 is up 14% year to date after gaining more than 20% annually over the past couple of years. Valuations are certainly elevated, but we believe the market is in a new world where higher multiples are normal rather than stretched.

Positive on productivity?
Chart of the week | Macroeconomic

Productivity, or output per hour worked, is a key driver of long-term economic growth. Now, after years of stagnation, productivity is on the rise again, a positive sign for future growth.

Gathering data
Disclaimer Not Available

This is a marketing communication