Please ensure Javascript is enabled for purposes of website accessibility Bullish on Fed Easing?
dk
en
institutional
institutional
false
true
Gathering data
Disclaimer Not Available

Bullish on Fed easing?

Bullish on Fed easing?

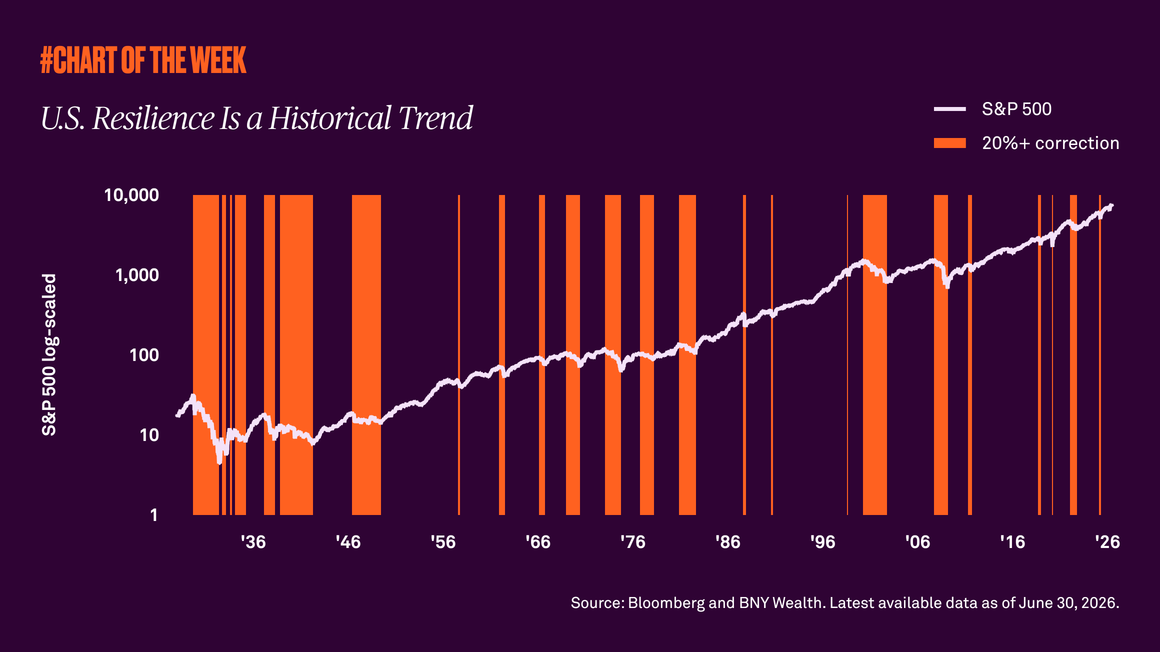
As expected, the Federal Open Market Committee delivered another 25-basis point rate cut. Investors are now focused on the pace of cuts from here. However, the more important driver of future equity returns is whether the Fed is easing into an economy that is growing or not. 

Chart-of-the-week-twentyfive


Last week, the Federal Reserve delivered a widely anticipated 25-basis point rate cut, What caught the market’s attention was pushback by Fed Chair Powell on the certainty of a December cut. But, regardless of the pace of easing from here, history tells us that future equity market performance is positive when the Fed eases into a growing economy. 

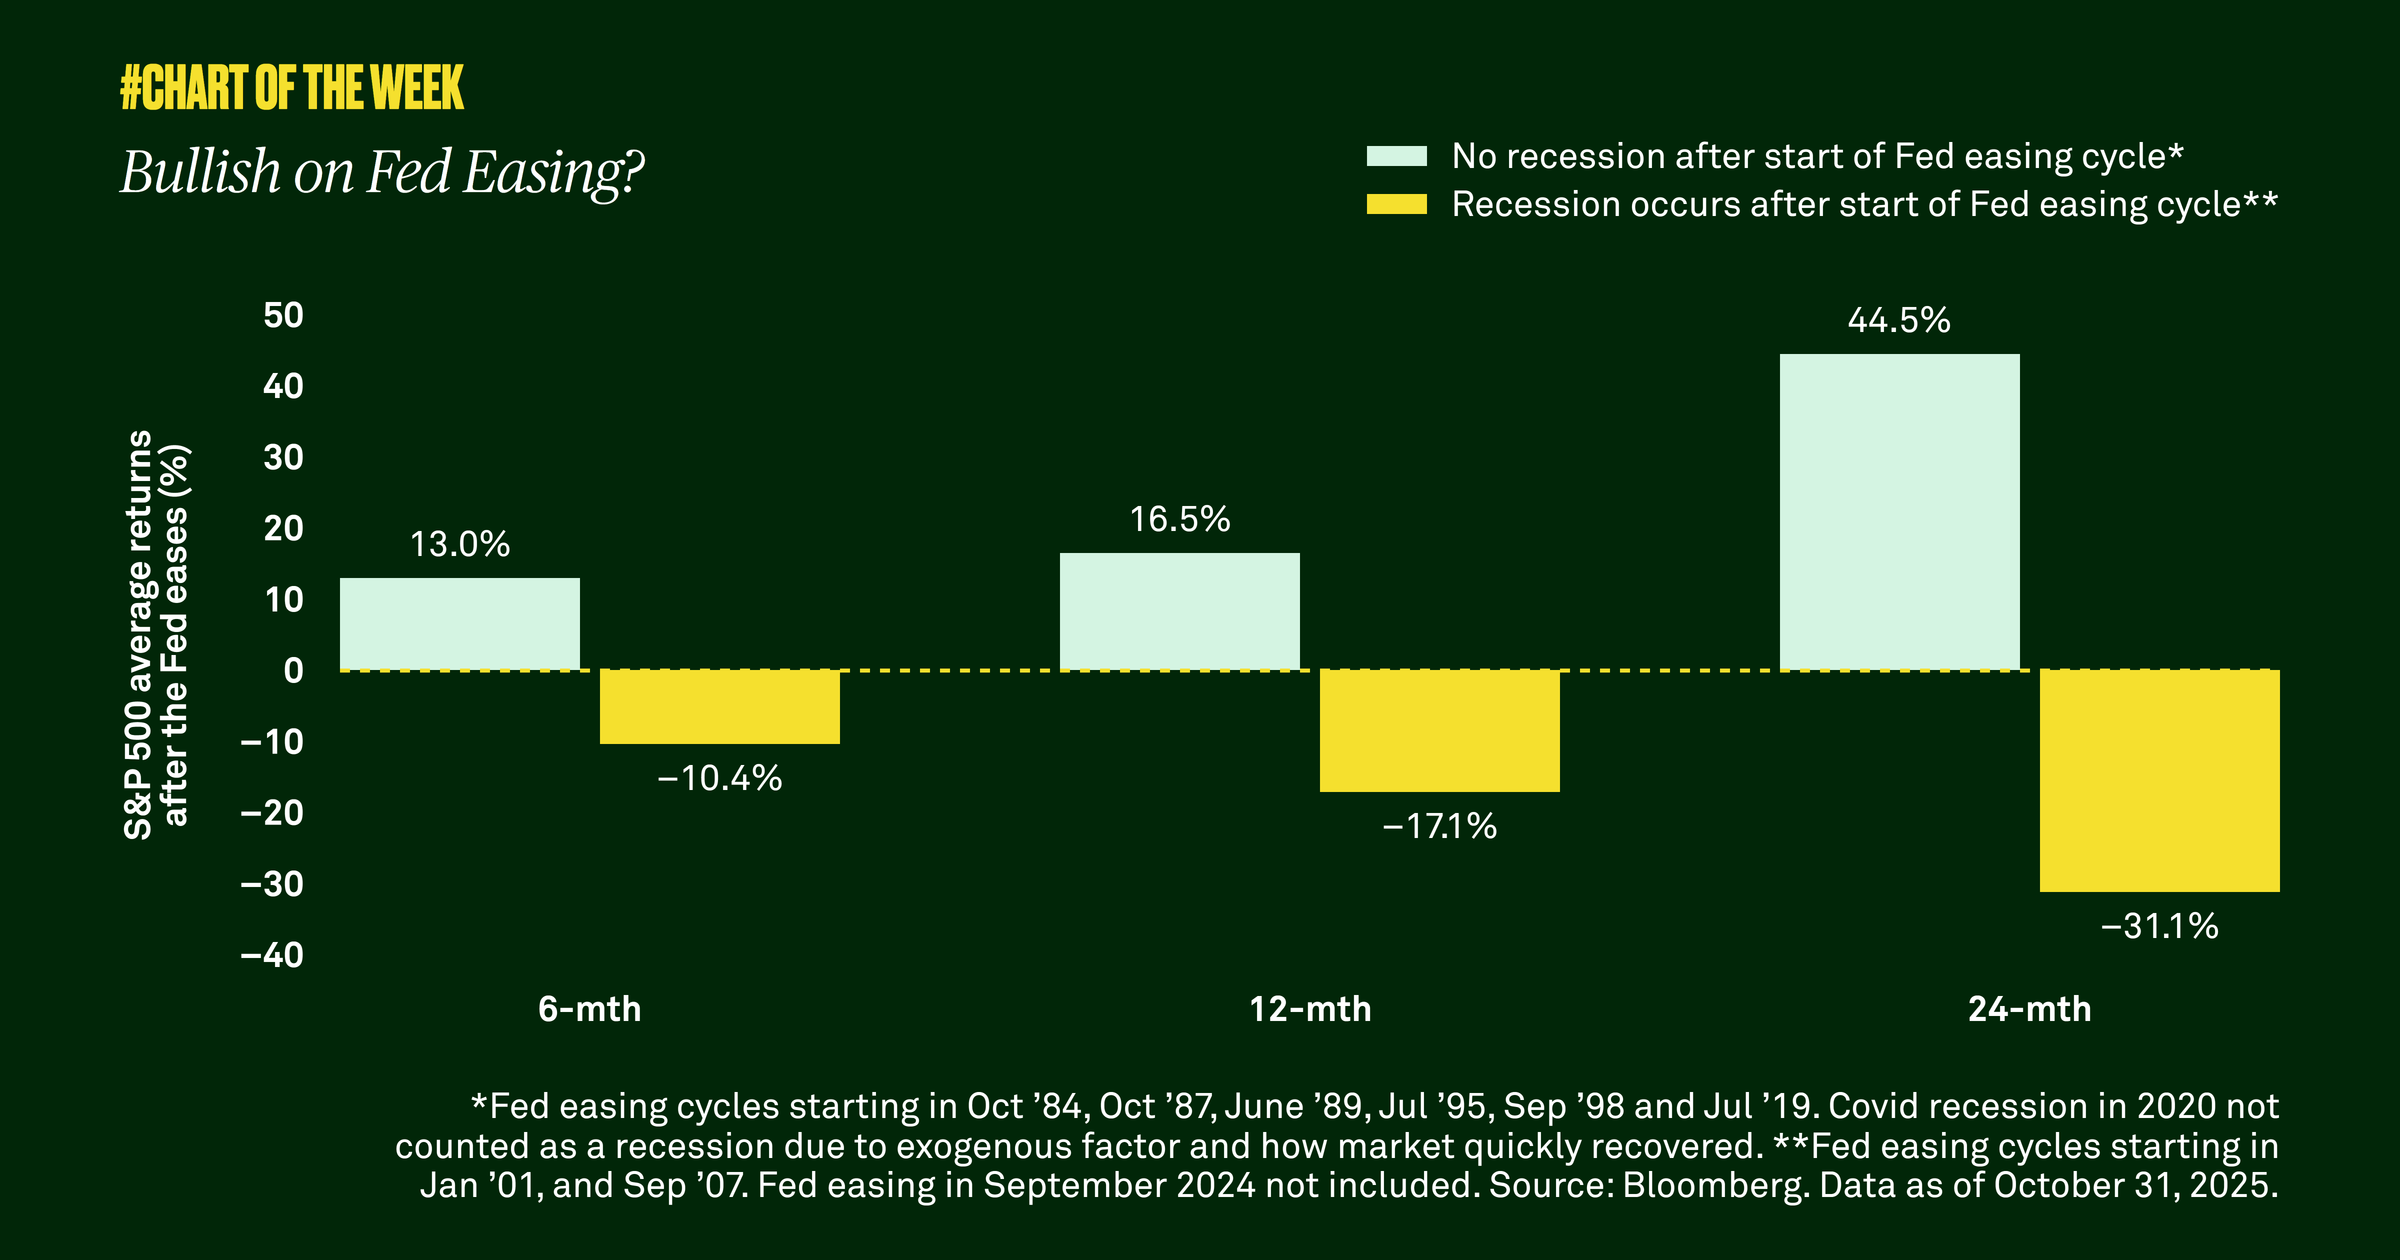
According to our research dating back to the 1980s, stocks delivered an average gain of 16.5% in the 12 months following the first cut of an easing cycle as long as a recession was avoided. The number ticks up to 44.5% over the first 24 months. While the Fed’s easing arguably started last year, we view the latest cuts and future expectations as a new cycle.

Given our outlook for continued positive economic growth over the next year, combined with an improving earnings backdrop, we expect more equity gains to come.  

RELATED CONTENT
Retail sales remain resilient
Chart of the week | Macroeconomic

Considering the slowing job market, we dove into retail sales data to search for signs of the direction of household spending. We analyzed existing-store sales and found that, despite the softening labor market and concerns about growth, aggregate consumer spending remains resilient.

Good news on inflation?
Chart of the week | Macroeconomic

Last week’s Consumer Price Index report, a widely used indicator of inflation in the U.S. economy, showed growth of 3% in September, which was above 2.9% in August but less than expected. Despite the modest increase, various categories have shown signs of stabilization. What does this mean for inflation going forward?

Bubble or is this market different?
Chart of the week | Macroeconomic

The S&P 500 is up 14% year to date after gaining more than 20% annually over the past couple of years. Valuations are certainly elevated, but we believe the market is in a new world where higher multiples are normal rather than stretched.

Positive on productivity?
Chart of the week | Macroeconomic

Productivity, or output per hour worked, is a key driver of long-term economic growth. Now, after years of stagnation, productivity is on the rise again, a positive sign for future growth.

Gathering data
Disclaimer Not Available

This is a marketing communication