Please ensure Javascript is enabled for purposes of website accessibility Resilient Retail Sales
be
en
institutional
institutional
false
true
Gathering data
Disclaimer Not Available

Resilient retail sales

Resilient retail sales

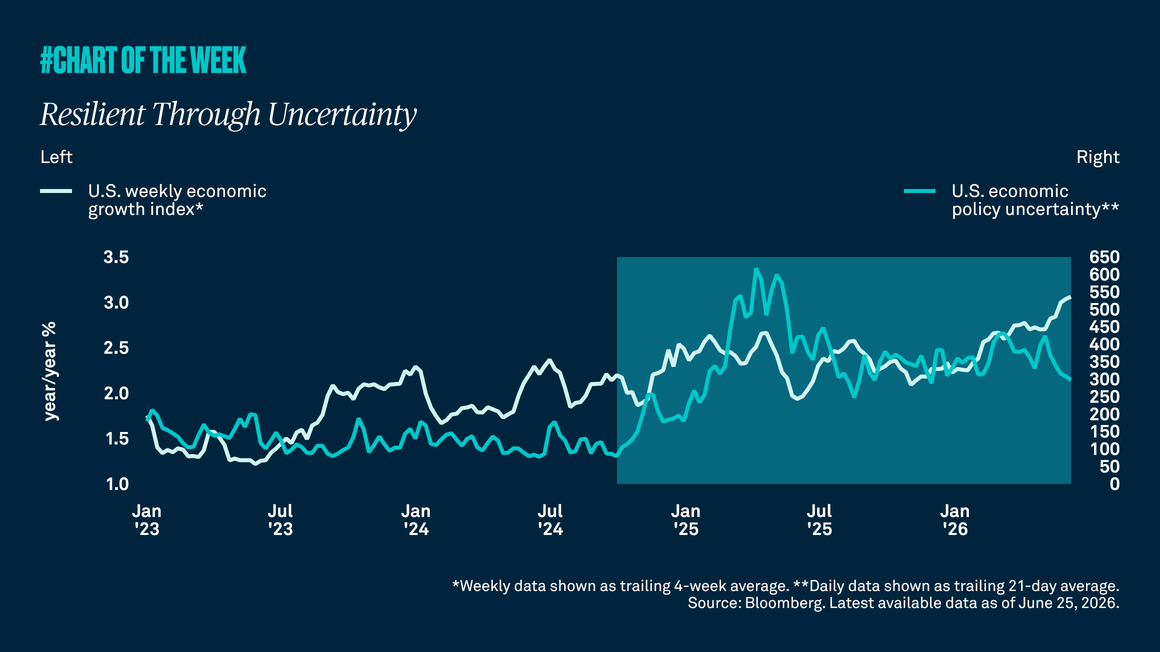
This year has been characterized by policy uncertainty and fears about the potential impact of tariffs on inflation. While many expected the consumer would crack amid weaker sentiment, it hasn’t happened yet. Retail sales remain resilient, supported by a job market that remains good enough to support spending.


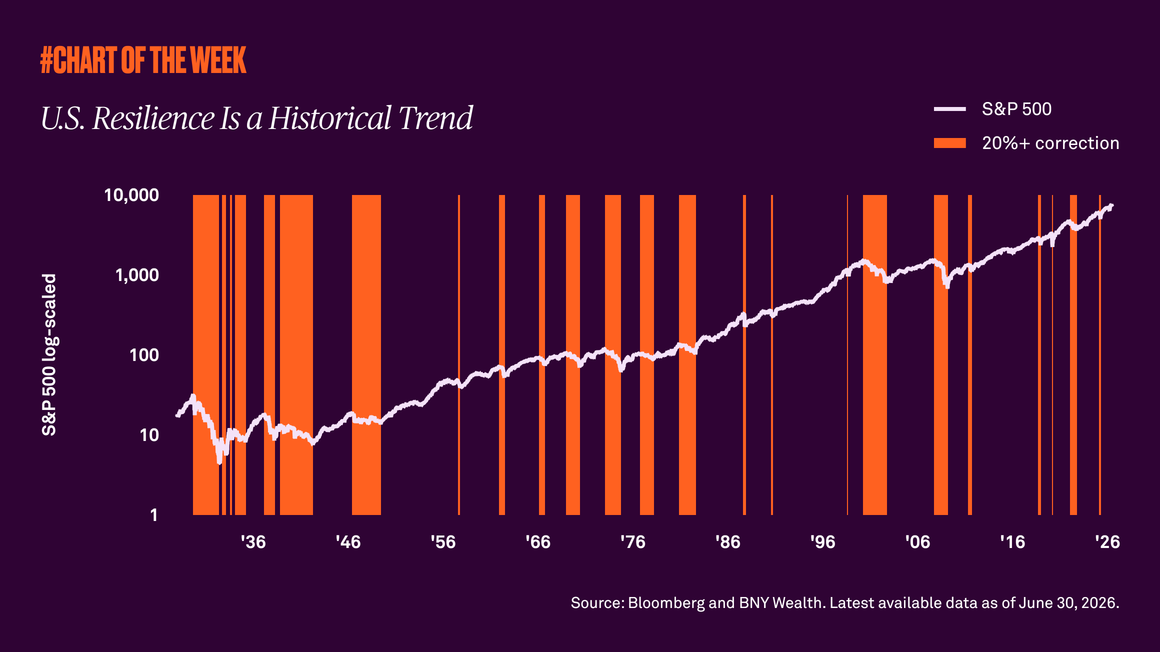
Although policy uncertainty around tariffs has kept investors worried about a potential slowdown, economic growth has remained resilient. The main driver has been continued consumer spending, which accounts for 70% of gross domestic product.

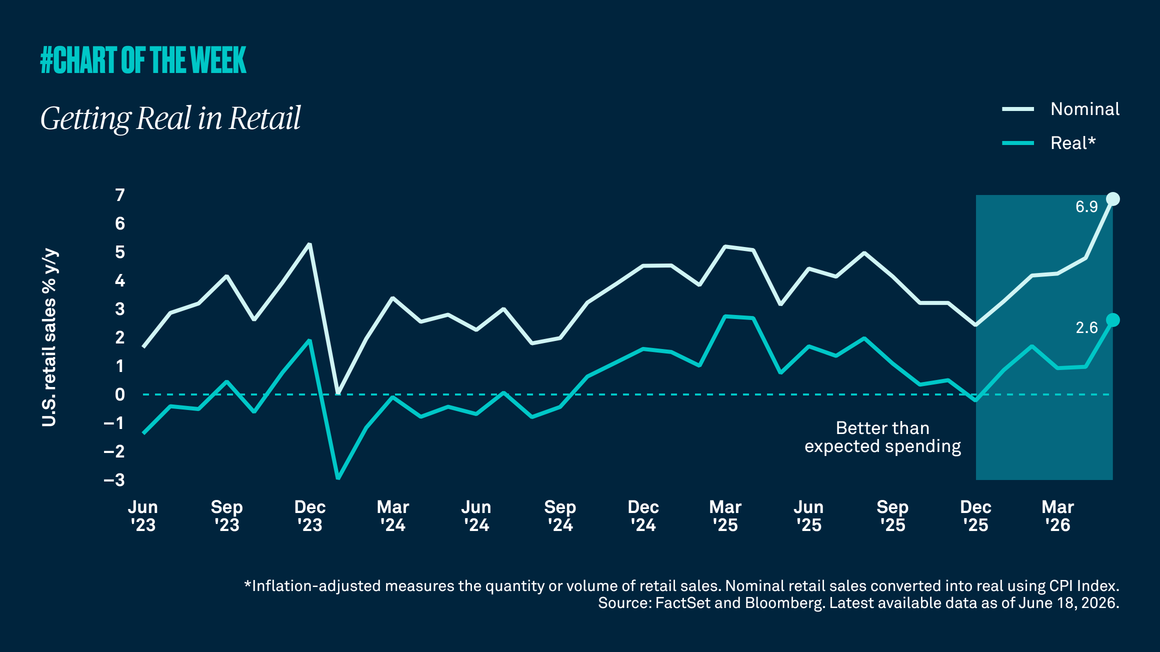
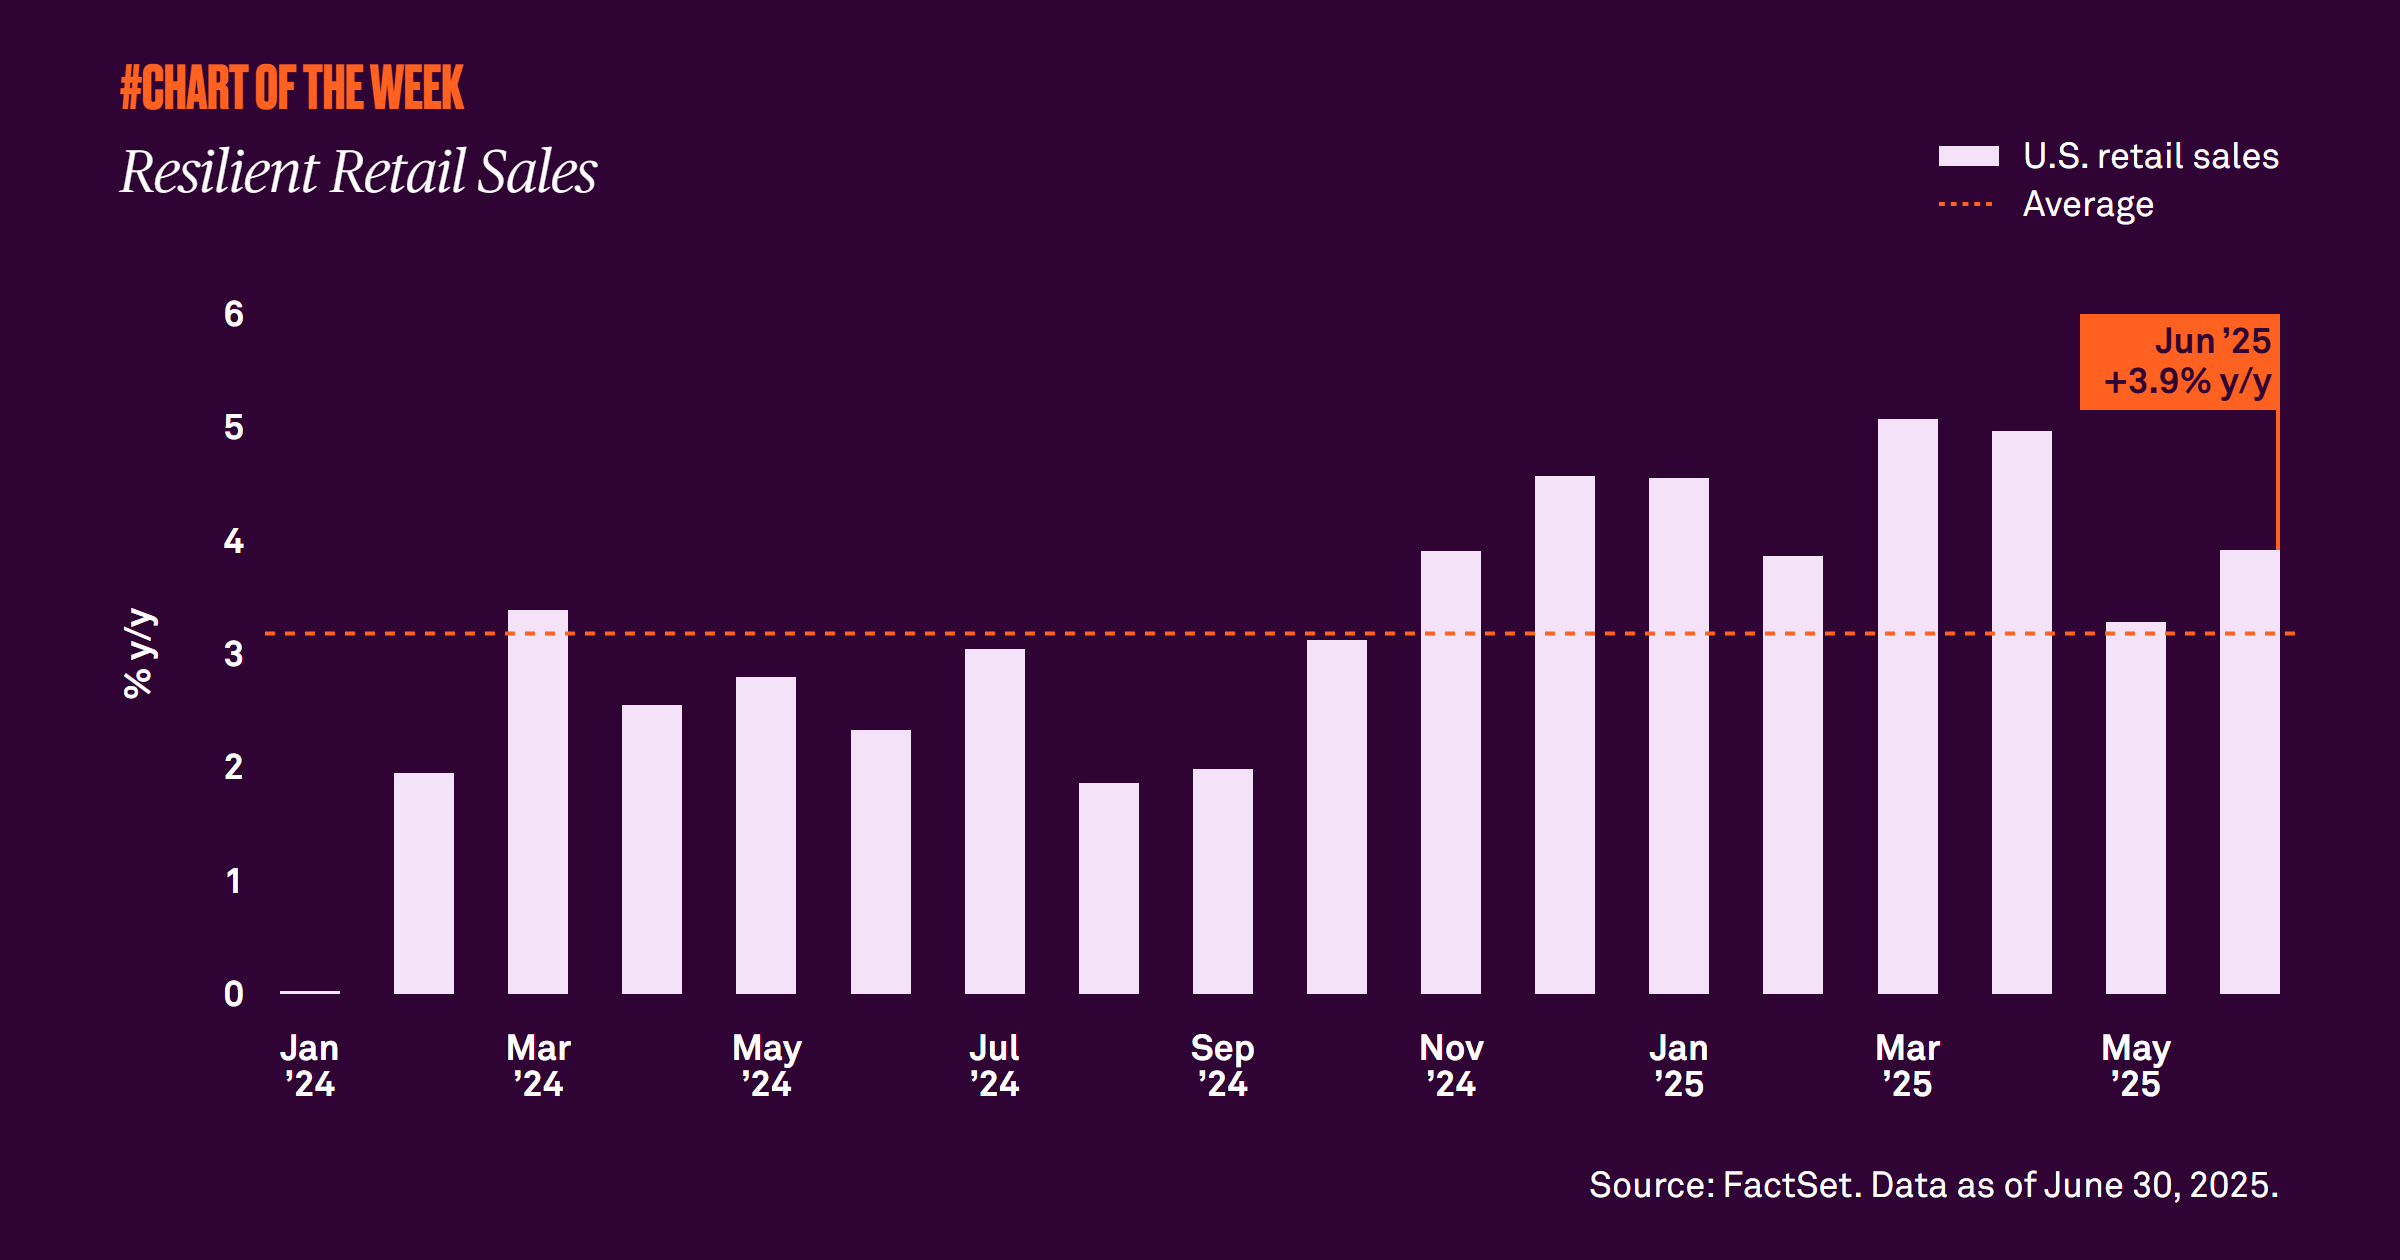
In June, retail sales, a proxy for consumption, grew 3.9% year over year, beating May’s 3.3% and surpassing the 3.2% average established since 2024. When we look at the underlying components, we find that consumers are still purchasing big-ticket items such as home appliances and furniture, and they are still dining out. Many investors have speculated that the consumer would crack amid the policy uncertainty and weakened sentiment, but so far spending has held up. A key reason has been the job market.

Though the job market has slowed somewhat, as evidenced by monthly payrolls, jobless claims have reversed their upward trajectory and have reached new lows over the past three months. In addition, the unemployment rate has held steady. The wealth effect, driven by rising equity and housing prices, has also supported spending.

Faced with a resilient consumer, we expect spending to support economic growth in the vicinity of 1% this year. 

RELATED CONTENT
Impact of geopolitics over time?
Chart of the week | Macroeconomic

Tensions between the U.S./Israel and Iran have recently boiled over into a military conflict, which has given many investors the jitters. However, our research shows that equity market pullbacks resulting from geopolitical events are often short lived with the S&P 500 typically higher in the months following these events.

Behind the numbers: Q4 GDP
Chart of the week | Macroeconomic

Gross domestic product undershot expectations last quarter, but the shortfall appears driven more by the temporary government shutdown than broad-based weakness. Consumer demand remains resilient, and with supportive fiscal policy, easing financial conditions and a steady labor market, the outlook points to a modest acceleration in economic activity this year.

Narrow drawdown?
Chart of the week | Macroeconomic

Equity volatility is rising, but all is not what it seems. The technology sector is weighing on the S&P 500 while value and cyclical stocks lead. A market rotation is underway as many investors begin to favor companies beyond tech.

Capex as a catalyst
Chart of the week | Macroeconomic

Improved business confidence and recent tax legislation are compelling corporations to reinvest their cash flows in their businesses. We believe this is a positive signal for economic growth.

Gathering data
Disclaimer Not Available

This is a marketing communication