The Strait of Hormuz, which moves about 20% of global oil, has seen many ships that normally travel through it curtail their activity. Consequently, WTI oil was up over 36% in the five days after the oil supply shock began. Yet equities barely budged, signaling a temporary supply shock, not a larger crisis. Historically, after similar price spikes equities tend to move higher while oil prices decline — further evidence for avoiding emotion-driven investing.
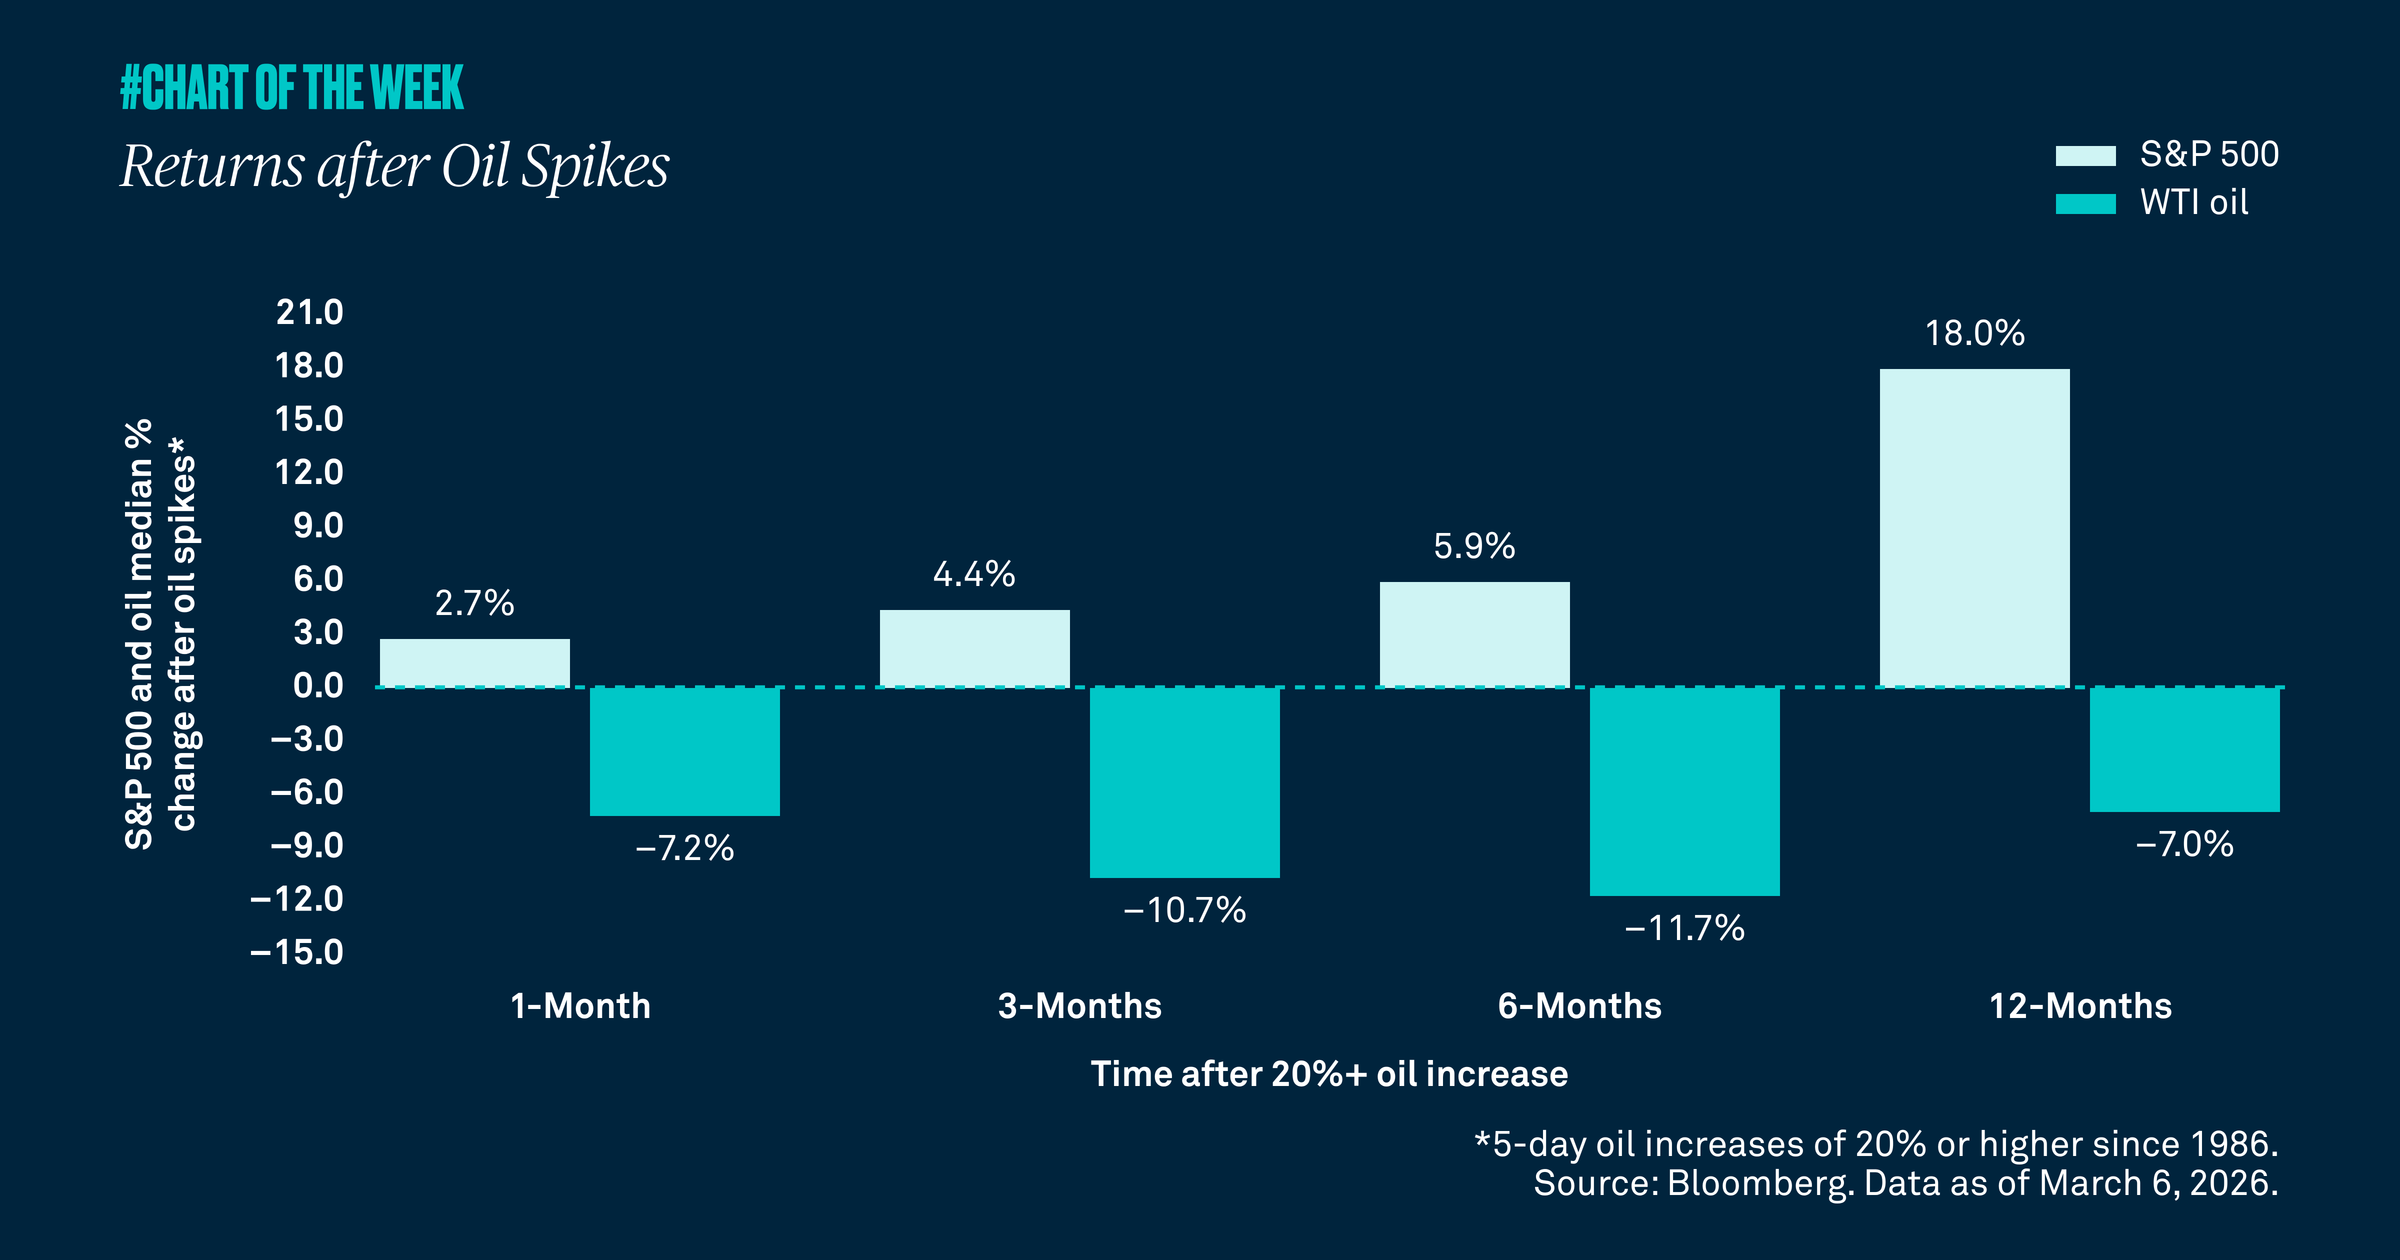
The Strait of Hormuz, which links the Persian Gulf to the Indian Ocean, sits at the heart of today’s Middle East tensions. It moves roughly 20% of global oil, yet ships are increasingly skirting the route amid Iranian attack risk. WTI oil surged more than 36% in the five days after the initial shock. Despite the hit to supply, the S&P 500 is down just 2.0% and energy stocks are up only 1.0%. These moves suggest markets see a temporary oil supply shock, not a broader crisis. If it were systemic, equities would sell off more sharply and energy would rally harder.
Our research supports this. After five‑day oil spikes of 20%+, equities have typically risen while oil prices declined. Since the 1980s, the median six‑month S&P 500 gain is about 6% as oil has fallen nearly 12% following such shocks.
Historically, equities have looked right through oil shocks and geopolitics — and we expect the same this year as Middle East shipping normalizes and markets refocus on oversupply combined with softer long‑term demand. It’s a reminder: emotion-driven investing doesn’t pay because markets often tune out oil headlines that tend to rattle investors.