The One Big Beautiful Bill Act (OBBBA) was passed in July. It includes tax code reforms and cuts in federal funding for certain programs. We believe the bill will significantly impact the U.S. deficit with consequences for the markets. Meanwhile, rising fiscal pressures are not just a U.S. story. The U.S. outlook reflects a broader pattern of fiscal deterioration throughout the global market due to aging populations, shifting geopolitical dynamics, and ongoing economic transitions.
What does the OBBBA mean for the U.S.?
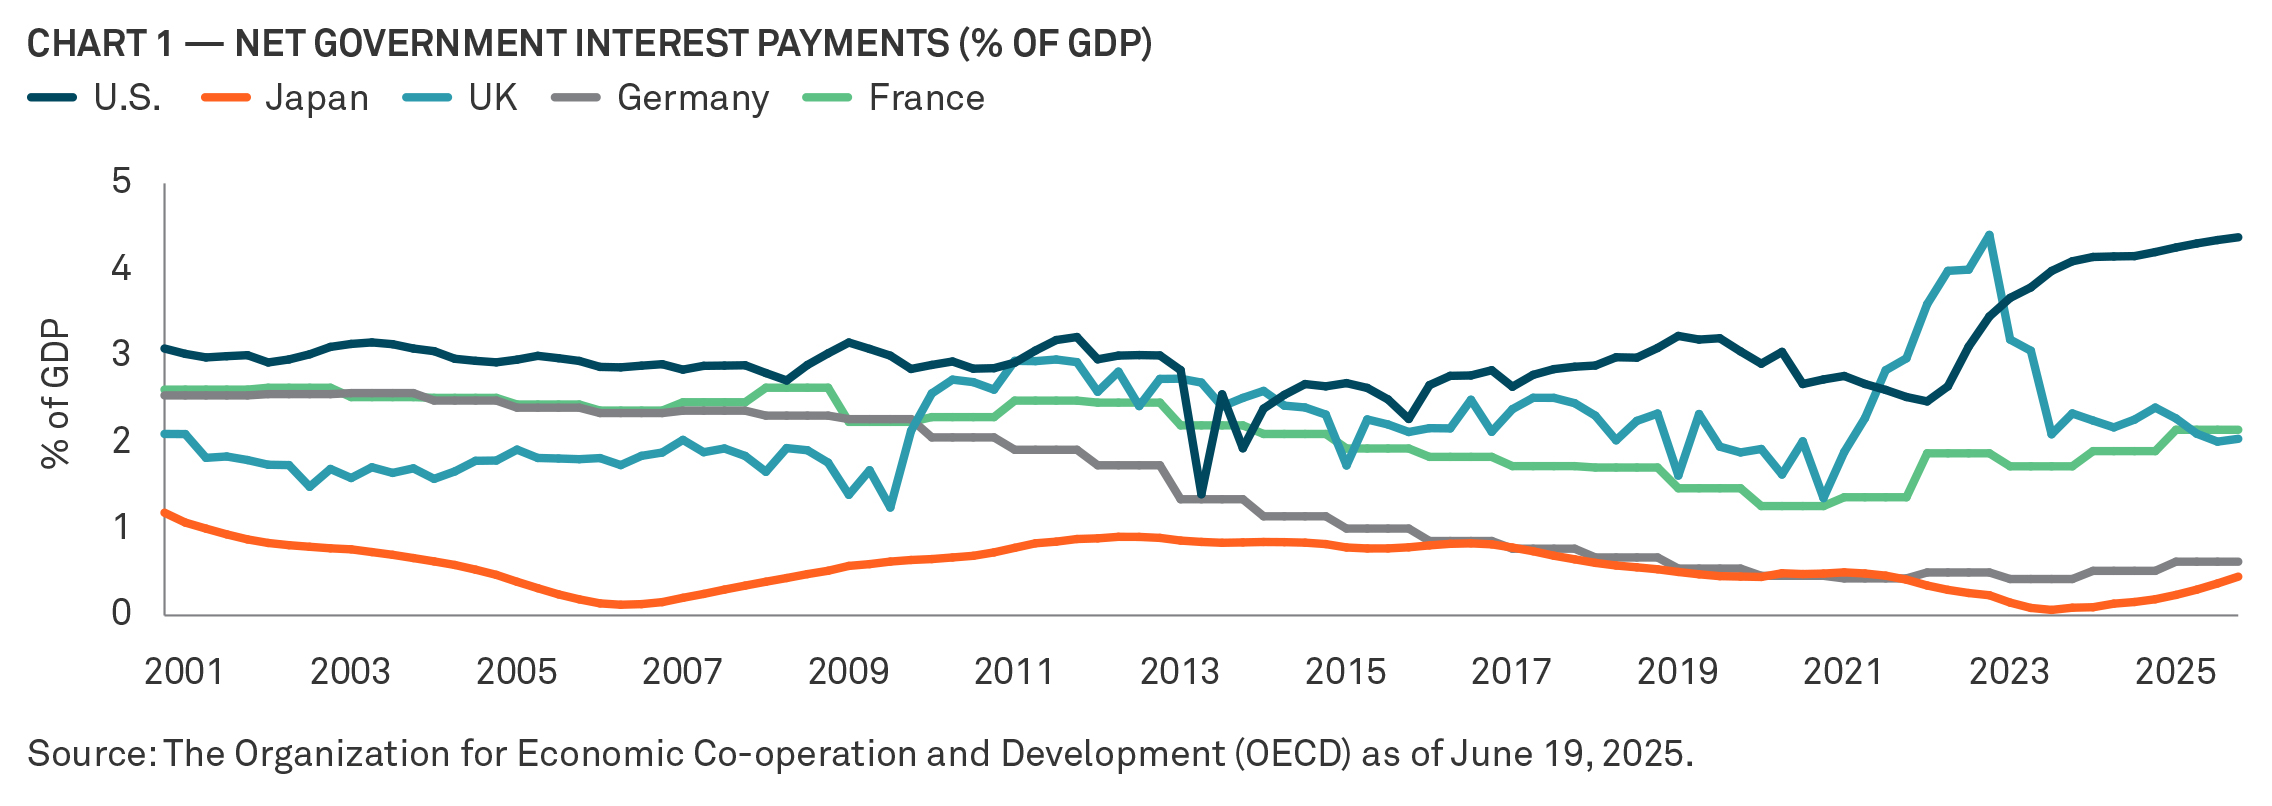
Tax revenues are declining relative to gross domestic product (GDP), government spending continues to increase, and there is little political momentum to address the growing fiscal gap. Furthermore, net interest payments make up a growing share of U.S. government spending, indicating an end of the era when negative real interest rates paid on government debt made the burden more manageable (Chart 1). According to the nonpartisan Congressional Budget Office, the new legislation is projected to add over $3 trillion to the national deficit over the next decade.1 This could lock in annual deficits of around 6% of GDP in the coming years — roughly double the post-World War II average — and push the national debt toward historic highs.
Outlook for markets
What does this mean for markets? If fiscal deterioration continues unchecked, investors may begin demanding higher compensation for the risks they face, which may lead to rising fiscal risk premiums and a structural steepening of yield curves. This steepening reflects growing concerns about creditworthiness and inflation, especially in countries where debt sustainability is in doubt. As a result, term premiums — the extra yield investors require to hold long-term bonds rather than rolling over short-term ones — could rise.
The effects of curve steepening are also felt on Main Street. For example, despite the Fed cutting its policy rate by 100 basis points (bps) since September 2024, mortgage rates have climbed from 6.1% to about 6.7%.2 This disconnect is partly explained by a steeper yield curve, which reflects deeper concerns about long-term fiscal risks.
As public debt rises, so does the cost of servicing it — leaving less room in government budgets for other priorities. In more extreme cases, this can push countries toward fiscal dominance, where central banks are pressured to keep interest rates low to help manage government borrowing costs. When that happens, it can weaken the central bank’s ability to control inflation and threaten its independence.
A global pattern
While the U.S. fiscal outlook is concerning, it’s part of a broader global trend. Aging populations, shifting geopolitical dynamics, and ongoing economic transitions are putting increasing strain on public finances around the world. As governments ramp up borrowing, the volume of marketable debt is rising — and so is the need for investors willing to absorb it. With major central banks like the Federal Reserve (Fed), Bank of Japan (BOJ), and the European Central Bank (ECB) reducing their asset holdings, investors are being asked to shoulder a greater share of the burden in financing deficits.
High deficits and rising debt burdens are becoming a shared challenge across both advanced and emerging economies. The International Monetary Fund’s (IMF’s) latest Fiscal Monitor projects global public debt to near 100% of GDP by the end of the decade, surpassing even the pandemic peak. The world’s other major economies — including Europe, Japan, and China — are each grappling with their own unsustainable trends and policy dilemmas.
Europe
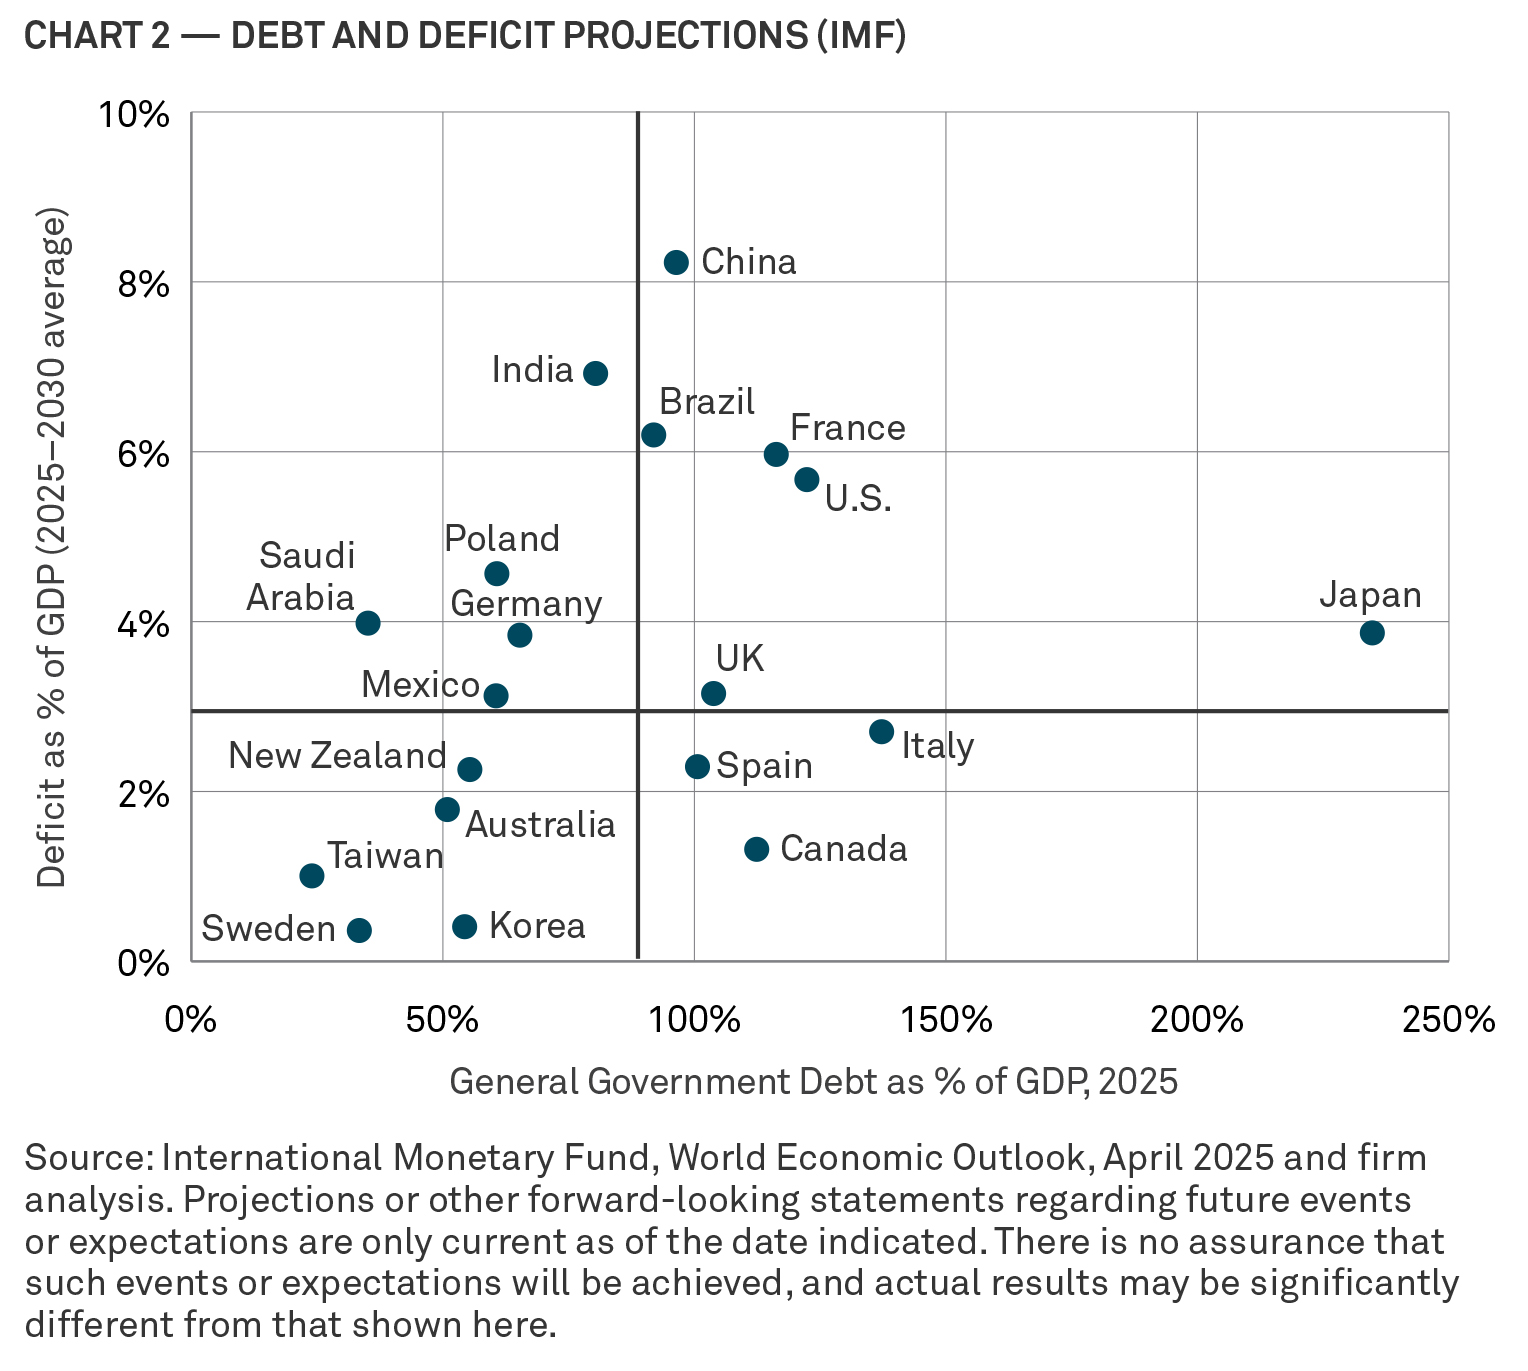
In Europe, the post-Cold War model of maintaining fiscal space by minimizing defense spending under the U.S. security umbrella — while relying on inexpensive Russian energy and Chinese imports — has been upended by geopolitics. Germany is re-thinking its fiscal stance and relaxing its constitutional debt brake to increase defense spending. Thanks to decades of fiscal discipline, Germany has a strong starting point, with headroom to grow its debt relative to its peers. France also plans to boost defense outlays, but its weaker fiscal position and fragmented political landscape pose challenges. Italy, despite having the second-highest debt burden in our chart’s sample (Chart 2), shows signs of improvement beneath the surface, helped by a primary budget surplus and less reliance on foreign investors.
Japan
Japan remains the most indebted major economy in terms of debt-to-GDP ratio. Its aging population and massive public debt represent a growing strain on future generations. Although most of the debt is domestically held, servicing it requires a significant transfer of resources from younger to older citizens, which is a burden that will intensify as the population shrinks and the BOJ gradually normalizes interest rates.
China
Meanwhile, China is navigating a difficult economic transition. Its growth model has shifted from export-driven expansion to a precarious mix of real estate stimulus and fiscal support, all while demographic trends continue to worsen. The IMF projects that China will run deficits of around 8% of GDP for the remainder of the decade to keep its economy on track.
Consequences of global fiscal deterioration
The consequences of fiscal deterioration can play out gradually, or they can be sudden and severe. Take the UK’s 2022 “Mini-Budget” crisis: fears of fiscal irresponsibility caused long-term gilt yields to spike, steepening the curve sharply. Investor confidence in the UK’s fiscal trajectory collapsed, and the pound fell over 11% against the dollar in the two months following the budget’s release and subsequent reversal.
A sharp pivot to austerity by major economies is neither realistic nor politically feasible. However, more sustainable budgets should be a priority to rebuild fiscal buffers for potential future shocks and to keep financial markets running smoothly. As economist Herbert Stein reminds us: “If something cannot go on forever, it will stop.”
1Source: Committee for a Responsible Federal Budget as of June 4, 2025.
2Source: Freddie Mac’s Primary Mortgage Market Survey. It is the weekly US average 30-year fixed rate mortgage as of July 31, 2025.
Important Information
This is a financial promotion and is not investment advice. Any views and opinions are those of the investment manager, unless otherwise noted. The value of investment can fall. Investors may not get back the amount invested. BNY, BNY Mellon and Bank of New York Mellon are the corporate brands of The Bank of New York Mellon Corporation and may also be used to reference the corporation as a whole and/or its various subsidiaries generally. BNY Investments encompass BNY Mellon’s affiliated investment management firms and global distribution companies. Any BNY entities mentioned are ultimately owned by The Bank of New York Mellon Corporation. In Hong Kong, the issuer of this document is BNY Mellon Investment Management Hong Kong Limited, which is registered with the Securities and Futures Commission (Central Entity Number: AQI762). In Singapore, this document is issued by BNY Mellon Investment Management Singapore Pte. Limited, Co. Reg. 201230427E. Regulated by the Monetary Authority of Singapore (MAS). This advertisement has not been reviewed by the Monetary Authority of Singapore.
MC612-13-08-2025 (6M)


