
How did markets perform during previous periods of volatility?
Market shocks are an inherent part of investing, and while volatility always feels unsettling in the moment, history provides a critical reminder: markets have weathered difficult periods before and have typically emerged stronger on the other side.
To put today’s market situation into perspective, we examine how various markets behaved during previous bouts of severe volatility.
DOT-COM BUST (2000–2002)
A long, grinding bear market
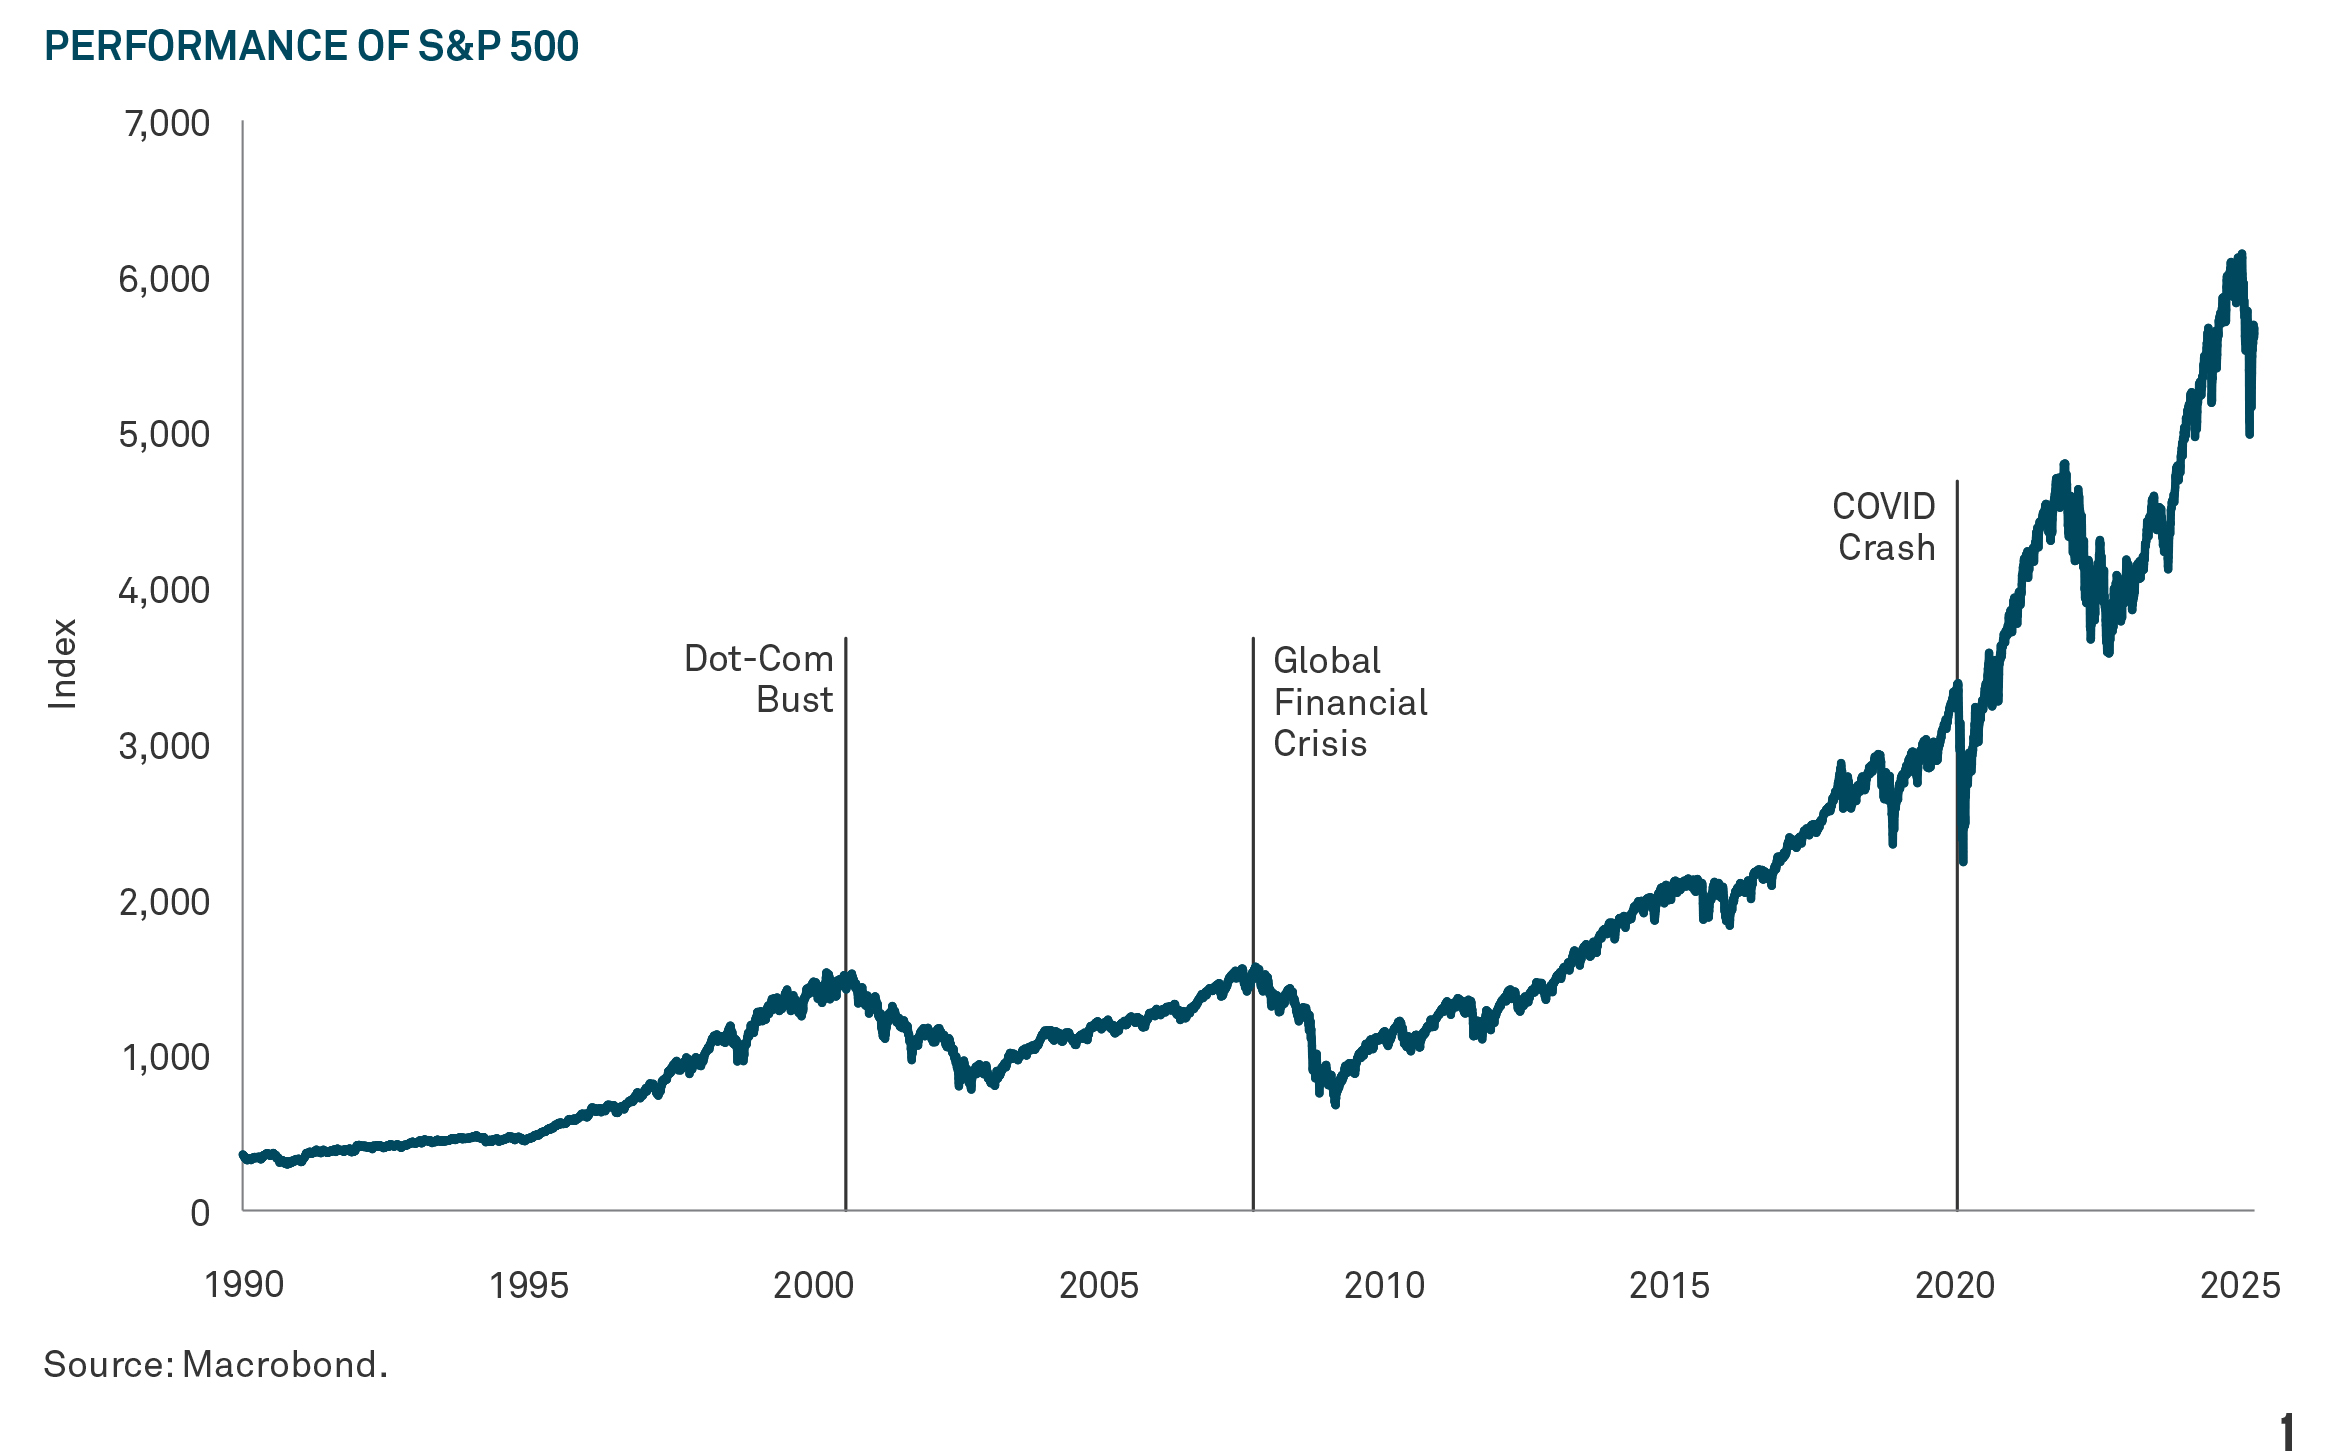
The bursting of the tech bubble in 2000 ushered in a prolonged bear market. From March 2000 through October 2002, the S&P 500 fell more than 47% over a period of more than two years. Technology stocks, captured by the NASDAQ Composite, fell even more dramatically, losing ~78% from peak to trough.1
Recovery during this period was slower than seen in other downturns. But still, a year after the bottom, by October 2003, the S&P 500 had rebounded 33%.2
The Dot-com downturn highlighted that while volatility can linger for an extended period, the long-term trajectory of the market can also remain intact.
GLOBAL FINANCIAL CRISIS (2007–2009)
Deepest drawdown, strongest rebound
The Global Financial Crisis (GFC) remains the most severe market downturn in modern history. The S&P 500 peaked in October 2007 and then fell for 17 months, bottoming in March 2009. Over that period, the index declined more than 55%. Yet, the recovery was also dramatic. In the 12 months following the March 2009 low, the index gained an extraordinary 70%.3
COVID CRASH (2020)
Fastest decline, fastest recovery
The COVID-19 pandemic triggered the fastest bear market in history In just over a month — from February 19 to March 23, 2020 — the S&P 500 lost 34% of its value. The speed and severity of the decline were unprecedented in modern history, reflecting the extraordinary uncertainty about the global economy as lockdowns swept across the world.
Yet, markets also rebounded rapidly. Massive fiscal and monetary stimulus helped fuel a significant rally. From the March 2020 bottom, the S&P 500 surged 74% over the next 12 months, one of the strongest one-year returns on record.4
A key takeaway from the GFC is that even deep downturns can become new cycles of growth, sometimes faster than many would have anticipated.
LIBERATION DAY (2025)
Sharp but short sell off
The April 2, 2025 Liberation Day tariff announcement triggered a swift market selloff. Equities declined and volatility rose amid concerns over slower growth, stickier inflation, and escalating trade tensions. Although the S&P 500 did not enter bear market territory, it fell almost 5% on the first trading day following the announcement, representing one of its steepest single-session losses since 2020.5 While market volatility persisted, the selloff lasted less than a week, with markets bottoming on April 8.
A subsequent de-escalation in tariff policy triggered a sharp relief rally. The market rebounded strongly on April 9, with the S&P 500 up more than 9% in one day and recovered its losses by mid-May.6 Both the selloff and recovery were driven by policy shifts, underscoring the market’s sensitivity to sudden changes in policy expectations.
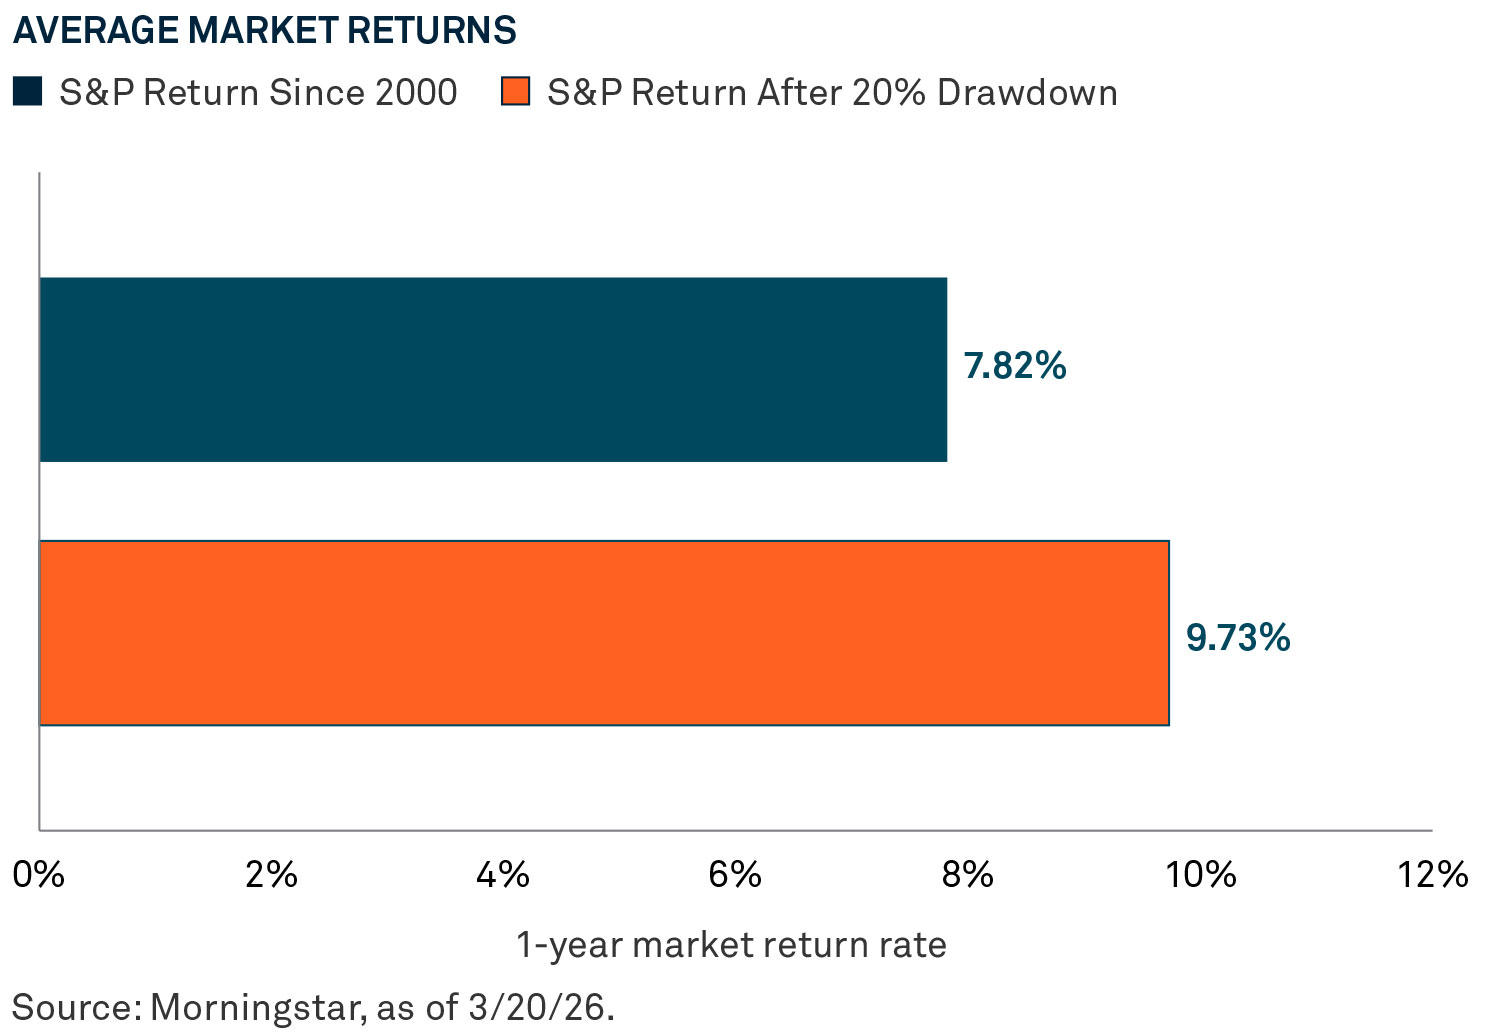
After deep drawdowns
Taking a step back to examine the S&P 500 more broadly, we see that since 2000, the average 1-year return is under 8%. However, since 2000, the average 1-year return after periods of a 20% drawdown is more than 9.7%.
Lessons for investors
Market history shows that though periods of volatility are painful, equity drawdowns have consistently been followed by recovery.
Overall, amid market volatility, it’s valuable to keep in mind that:
1. Market declines are a feature, not a bug, of long-term investing.
2. The depth of a downturn does not preclude a strong rebound.
3. Trying to time the market amid uncertainty is exceedingly difficult — and often counterproductive.
4. Staying invested, diversified, and focused on long-term goals remains a reliable strategy.
In times of turbulence, perspective is one of the most powerful tools an investor can have. History suggests that volatility, however uncomfortable, is rarely the end of the story.
1–4 Morningstar, April 2025.
The S&P 500® Index is a widely accepted, unmanaged index of U.S. stock market performance. An investor cannot invest directly in any index.
DISCLAIMER
The information contained herein reflects general views and is provided for informational purposes only. This material is not intended as investment advice nor is it a recommendation to adopt any investment strategy.
Opinions and views expressed are subject to change without notice.
Past performance is not necessarily indicative of future results.
ISSUING ENTITIES
This material is only for distribution in those countries and to those recipients listed, subject to the noted conditions and limitations: • United States: by BNY Mellon Securities Corporation (BNYSC), 240 Greenwich Street, New York, NY 10286. BNYSC, a registered broker-dealer and FINRA member, has entered into agreements to offer securities in the U.S. on behalf of certain BNY Investments firms. • Europe (excluding Switzerland): BNY Mellon Fund Management (Luxembourg) S.A., 2-4 Rue Eugène Ruppert L-2453 Luxembourg. • UK, Africa and Latin America (ex-Brazil): BNY Mellon Investment Management EMEA Limited, BNY Mellon Centre, 160 Queen Victoria Street, London EC4V 4LA. Registered in England No. 1118580. Authorised and regulated by the Financial Conduct Authority. • South Africa: BNY Mellon Investment Management EMEA Limited is an authorised financial services provider. • Switzerland: BNY Mellon Investments Switzerland GmbH, Bärengasse 29, CH-8001 Zürich, Switzerland. • Middle East: DIFC branch of The Bank of New York Mellon. Regulated by the Dubai Financial Services Authority. • South East Asia and South Asia: BNY Mellon Investment Management Singapore Pte. Limited Co. Reg. 201230427E. Regulated by the Monetary Authority of Singapore. • Hong Kong: BNY Mellon Investment Management Hong Kong Limited. Regulated by the Hong Kong Securities and Futures Commission. • Japan: BNY Mellon Investment Management Japan Limited. BNY Mellon Investment Management Japan Limited is a Financial Instruments Business Operator with license no 406 (Kinsho) at the Commissioner of Kanto Local Finance Bureau and is a Member of the Investment Trusts Association, Japan and Japan Investment Advisers Association and Type II Financial Instruments Firms Association. • Brazil: ARX Investimentos Ltda., Av. Borges de Medeiros, 633, 4th floor, Rio de Janeiro, RJ, Brazil, CEP 22430-041. Authorized and regulated by the Brazilian Securities and Exchange Commission (CVM). • Canada: BNY Mellon Asset Management Canada Ltd. is registered in all provinces and territories of Canada as a Portfolio Manager and Exempt Market Dealer, and as a Commodity Trading Manager in Ontario. All issuing entities are subsidiaries of The Bank of New York Mellon Corporation.
NOT FDIC INSURED | NO BANK GUARANTEE | MAY LOSE VALUE |
© 2026 THE BANK OF NEW YORK MELLON CORPORATION
MARK-905913-2026-03-24
GU-832- 31 March 2027