Please ensure Javascript is enabled for purposes of website accessibility Crisis and Comeback: Market Behavior During Historical Bouts of Volatility
sg
en
individual
individual
false
true
Gathering data
Disclaimer Not Available

How did markets perform during previous periods of volatility?

Markets have once again found themselves on unsteady ground, this time rattled by escalating trade tensions and uncertainty around the trajectory of tariffs. While volatility always feels unsettling in the moment, history provides a critical reminder: markets have weathered difficult periods before and have typically emerged stronger on the other side.

To put today’s market situation into perspective, we examine how various markets behaved during previous bouts of severe volatility.


DOT-COM BUST
(2000–2002)
 

A long, grinding bear market

The bursting of the tech bubble in 2000 ushered in a prolonged bear market. From March 2000 through October 2002, the S&P 500 fell more than 47% over a period of more than two years. Technology stocks, captured by the NASDAQ Composite, fell even more dramatically, losing ~78% from peak to trough.1

Recovery during this period was slower than seen in other downturns. But still, a year after the bottom, by October 2003, the S&P 500 had rebounded 33%.2

The Dot-com downturn highlighted that while volatility can linger for an extended period, the long-term trajectory of the market can also remain intact.


GLOBAL FINANCIAL CRISIS
(2007–2009)


Deepest drawdown, strongest rebound

The Global Financial Crisis (GFC) remains the most severe market downturn in modern history. The S&P 500 peaked in October 2007 and then fell for 17 months, bottoming in March 2009. Over that period, the index declined more than 55%. Yet, the recovery was also dramatic. In the 12 months following the March 2009 low, the index gained an extraordinary 70%.3

A key takeaway from the GFC is that even deep downturns can become new cycles of growth, sometimes faster than many would have anticipated.


COVID CRASH
(2020)
 

Fastest decline, fastest recovery

The COVID-19 pandemic triggered the fastest bear market in history In just over a month — from February 19 to March 23, 2020 — the S&P 500 lost 34% of its value. The speed and severity of the decline were unprecedented in modern history, reflecting the extraordinary uncertainty about the global economy as lockdowns swept across the world.

Yet, markets also rebounded rapidly. Massive fiscal and monetary stimulus helped fuel a significant rally. From the March 2020 bottom, the S&P 500 surged 74% over the next 12 months, one of the strongest one-year returns on record.4


After deep drawdowns

Taking a step back to examine the S&P 500 more broadly, we see that since 2000, average market returns are just under 7%. However, since 2000, the average 1-year return after periods of a 20% drawdown are more than 9.7%.5

Bond markets: duration could be your friend

In each of the three market crises we’ve addressed, bond yields fell as investors sought the safety of fixed income. For example, during the GFC, the 10-year U.S. Treasury yield, which stood above 5% in mid-2007, fell to below 2.5% by the end of 2008. Yields remained below 4% for most of the next decade, as the Federal Reserve maintained ultra-accommodative policies to support the economy.6

During the Covid-19 pandemic, bond markets reacted sharply — the 10-year Treasury yield plunged to an all-time low of just ~0.5% in March of 2020 and remained below 2% until economies around the world reopened in 2022.7

Longer-duration bonds (Treasuries with 10-to-30-year maturities) saw significant capital appreciation during these periods due to bond prices surging. In some cases, these gains helped stabilize portfolios and provided total return, even though rates were low.

It’s notable that during these times that spreads on sub-investment grade bonds widened significantly, suggesting caution around over-exposure to high yield credit during volatile times.

Lessons for investors

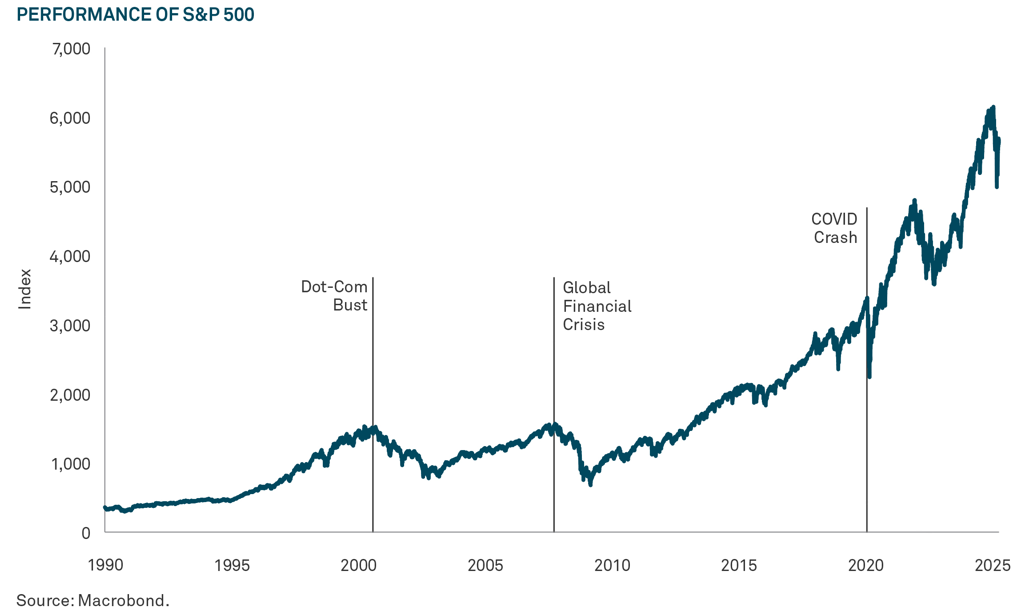
Market history shows that though periods of volatility are painful, equity drawdowns have consistently been followed by recovery. And while bond yields have historically taken longer to recover, there are opportunities in fixed income during volatile times as well.

Overall, amid market volatility, it’s valuable to keep in mind that:

1. Market declines are a feature, not a bug, of long-term investing.

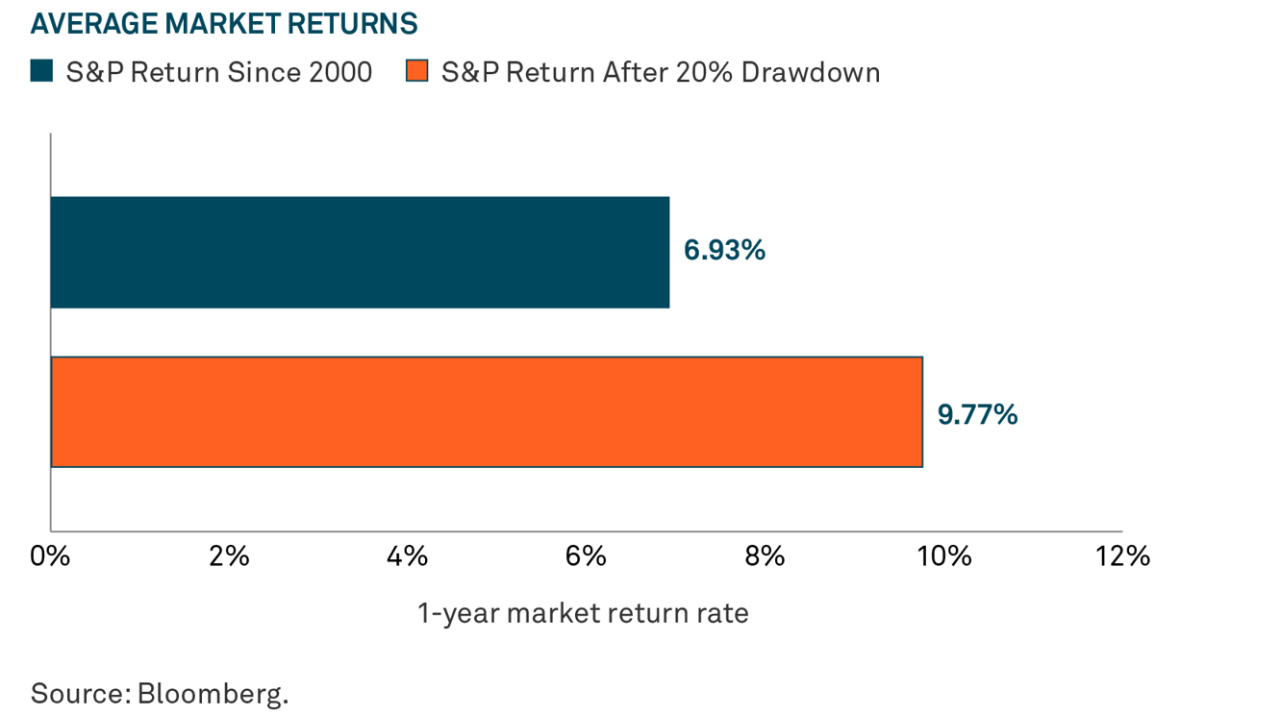
2. The depth of a downturn does not preclude a strong rebound.

3. Trying to time the market amid uncertainty is exceedingly difficult — and often counterproductive.

4. Staying invested, diversified, and focused on long-term goals remains a reliable strategy.

1-4 Morningstar, April 2025.
5-7 Bloomberg, April 2025.


Important Information

This is a financial promotion and is not investment advice. Any views and opinions are those of the investment manager, unless otherwise noted. The value of investment can fall. Investors may not get back the amount invested. BNY, BNY Mellon and Bank of New York Mellon are the corporate brands of The Bank of New York Mellon Corporation and may also be used to reference the corporation as a whole and/or its various subsidiaries generally.  BNY Investments encompass BNY Mellon’s affiliated investment management firms and global distribution companies.  Any BNY entities mentioned are ultimately owned by The Bank of New York Mellon Corporation. In Hong Kong, the issuer of this document is BNY Mellon Investment Management Hong Kong Limited, which is registered with the Securities and Futures Commission (Central Entity Number: AQI762). In Singapore, this document is issued by BNY Mellon Investment Management Singapore Pte. Limited, Co. Reg. 201230427E. Regulated by the Monetary Authority of Singapore (MAS). This advertisement has not been reviewed by the Monetary Authority of Singapore.


MC526-29-05-2025 (6M)
 

Gathering data
Disclaimer Not Available

CONTACT US  |  +65 6654 1000  |  cs.im.apac@bny.com