Market Movers: Constrained
Market Movers highlights key activities and developments before the U.S. market opens each morning.
Market Movers highlights key activities and developments before the U.S. market opens each morning.

Geoffrey Yu
Time to Read: 6 minutes
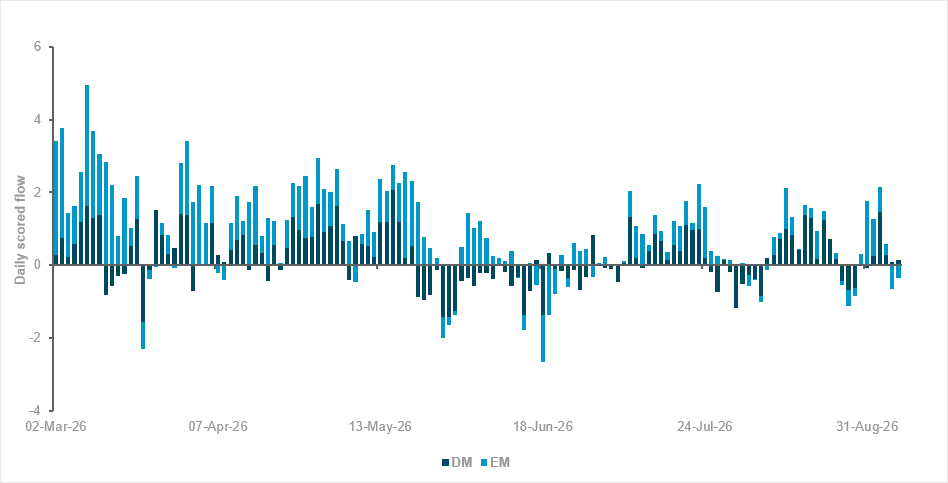
Flows into global energy stocks softer than in Q2
Source: BNY
Brent crude hit $100/barrel overnight for the first time since late July, and this is being felt across energy-linked assets globally. Institutional investors are rebuilding exposure after taking profits earlier in the summer, supported by the earnings lift and energy’s role as a real asset hedge. Flows are continuing to perform well despite a hawkish shift by the Fed, indicating that pricing is now moving independently of financial conditions.
Breaking the flows down into developed and emerging market energy names, we see two key differences compared with the flows in Q1. Firstly, developed market flow scores are dominant during this phase, suggesting that investors view these markets as better-positioned to capture any earnings lift. Secondly, the combined flow magnitudes remain less consistent than in the escalation period. This shows that markets are responding tactically to the price action in oil but not committing to any material re-rating yet. The inferences are that supply factors remain dominant and there is a risk that the significant restraint materializing through global supply channels and central bank responses warrants a more cautious approach. In another sign of light conviction, our data show that after a period of alignment retail investors have been liquidating their energy holdings in recent sessions, diverging from institutional flows.
Supply fears are intensifying. Low-level kinetic activity in the Gulf continued overnight, but markets are increasingly pricing in a prolonged period of supply stress as Brent moves decisively above $100/barrel. There is little sign of diplomatic progress, with Tehran warning that any resolution from today’s IAEA Board of Governors meeting, even under the guise of diplomacy, would be viewed as hostile.
Not just about oil. The BoE, which is far from the most hawkish G10 central bank, warned yesterday that conflict and climate could generate another “burst” of U.K. inflation, particularly with food prices compounding energy stress. Compared with 2022, food inflation has so far been less affected by the conflict, despite initial concerns over global fertilizer supplies. As winter approaches, however, central banks are confronting a broader basket of supply pressures. The deteriorating outlook has clearly contributed to multiple policy pivots in recent weeks.
JPY consolidates gains. U.S. Treasury Secretary Scott Bessent’s warnings against testing the authorities’ resolve on JPY intervention appear to be resonating. USDJPY moved below 153 again overnight, albeit with limited follow-through. The more important response must come from the BoJ, particularly through establishing a tightening cycle that extends well beyond September. This week’s data confirming Japanese selling of U.S. Treasurys have had little immediate market impact, but the headline numbers underscore the risks to U.S. paper and the importance of JPY stability.
Holding pattern extends. The U.S. calendar is light today, with MBA mortgage applications and the ADP Weekly Employment Report the main releases. Meanwhile, major central banks are in pre-decision blackouts. Every data point reinforcing the supply shock narrative raises the marginal cost of affected goods and services. Central bank inflation targets are fixed; the forces driving inflation are becoming increasingly dynamic.
The White House has announced the signing of five proclamations under Section 338 of the Tariff Act, as President Trump responds to Canada’s new retaliation against U.S. exports. The U.S. has announced new import bans and higher tariffs on selected Canadian products, alongside a move to restrict Canadian firms from selling to U.S. government contractors. The measures target whey proteins, certain rye whiskeys, malt beer, grape wines, non-alcoholic beer and motorcycles, while Section 338 tariffs were expanded to certain cheeses, animal hides, motorboats, aluminum products, paper products, golf carts and mattresses. Some items that were previously hit, including salt and toilet paper, were exempted. The bans on dairy and alcohol take effect in three weeks (September 29), and the tariff changes in one week (September 15). Trump also kept alive a threat to raise Canadian auto tariffs to 50% on January 1. Canada, led by Mark Carney, has vowed to retaliate dollar-for-dollar and has already imposed counter-tariffs. S&P Mini +0.11% to 7689, DXY -0.115% to 98.674, 10y UST +1.1bp to 4.798%.
Iraq is seeking a significant increase in its OPEC+ production quota as the group reviews member capacity ahead of setting future targets. Baghdad wants its baseline to be raised to 6 million barrels/day, well above its current September-October ceiling of 4.431 million and the IEA’s estimated sustainable capacity of 4.9 million. The request is significant both for global supply balances and for OPEC+ cohesion, with Iraq having previously suggested it could reconsider its membership if denied a higher baseline. The review is due to conclude this month before ministerial ratification in November. Iraq’s ambitions are substantial, with officials targeting 5 million barrels/day after the Iran conflict and around 10 million by 2030, although current output is much lower. Brent +1.829% to 99.71, WTI +1.269% to 94.21, Omani crude +11.59% to 117.18, Dubai crude +4.918% to 105.087.
Fitch Ratings has said Japanese investors’ move into domestic bonds is gradual rather than abrupt. Higher JGB yields are encouraging insurers to sell low-coupon holdings and reinvest in newly issued higher-coupon paper, boosting future coupon income and policyholder dividends under Japanese GAAP. Fitch does not expect a fire-sale of existing JGB portfolios, as under accounting rules insurers can hold them without realizing losses. The report also highlights a shift in foreign allocations as hedging costs have eased, supporting continued buying of currency-hedged USD investment-grade corporates, with some migration toward BBB credit. Japanese investors are expected to retain JGBs as a core holding, while foreign treasuries and high-grade bonds lose appeal relative to domestic debt. Fitch expects policy rates to rise faster than markets are predicting in 2026-2027, further supporting the yen and JGB demand. Nikkei -0.19% to 65143, USDJPY +0.692% to 153.18, 10y JGB -1.5bp to 2.885%.
PwC has said that global investment in AI infrastructure is set to reach $31.6tn by 2050, with annual data center capex rising from about $800bn in 2026 to $1.8tn by that date. The U.S. is projected to take 48% of cumulative investment, or $15.1tn, while Asia Pacific should account for $8.2tn, led by China and India. PwC said recurring chip upgrades, rather than construction, will drive most long-term spending, lifting ICT equipment’s share of investment from 70% today to 93% by 2050. Power availability is identified as the key constraint, alongside connectivity, security, policy certainty, community consent and GPU access. Under tighter export controls, cumulative investment could fall to $25.5tn, while sovereignty-driven shifts would mainly redistribute spending. Aluminum (LME) +0.977% to 3349.51, iron ore (SGX) -1.01% to 100, copper (CMX) -0.36% to 679.9.
Narodowy Bank Polski (NBP) is expected to keep rates unchanged at 3.75%, and we don’t see any pre-emption of the ECB’s decision. Governor Adam Glapiński recently stated that there was no pre-set path for interest rates, but in light of Hungary potentially lowering its inflation target to apply more a restrictive policy, the bias may need to shift until there is clear sign of easing in supply stress.
U.S. ADP weekly employment change is released; the prior reading was 11.75k.
U.S. Treasury sells $72bn in 17-week bills and $39bn in a 10y note reopening.
Mood: iFlow Mood narrowed at a faster pace as investors reduced core sovereign bond exposure more aggressively than global equities. Higher global yields are increasingly weighing on bond flows.
FX: Strong USD and JPY inflows contrasted with heavy selling in GBP, MXN and EUR. Elsewhere, APAC, EMEA and LatAm currencies saw moderate inflows.
FI: Sovereign bond demand softened, although U.K. gilts and Canadian and Japanese government bonds attracted relatively stronger buying.
Equities: LatAm equities saw broad-based demand. G10 flows were mixed, with substantial selling in Europe and Australia, while China and Türkiye recorded the largest outflows.
“Plans are worthless, but planning is everything.” – Dwight D. Eisenhower
“Redundancy is ambiguous because it seems like a waste if nothing unusual happens. Except that something unusual happens – usually.” – Nassim Nicholas Taleb
France’s manufacturing output fell 0.8% m/m in July after a 1.0% decline in June, while total industrial production decreased by 0.4% after 0.1%. Weakness was broad-based, with transport equipment down 2.8%, machinery and equipment goods down 0.8%, and other manufacturing down 0.5%. Food and beverage output was close to stable, falling 0.1%, while coke and refined petroleum production rebounded by 8.3%. Mining, energy and water supply rose 0.9%, supported by stronger electricity production during the July heatwave. Over May-July, total industrial output was 0.8% higher y/y, but manufacturing production was 0.4% lower, with transport equipment and food production remaining significant drags. CAC 40 -0.83% to 8249, EURUSD +0.121% to 1.1638, 10y OAT +2.6bp to 4.259%.
Japan’s money supply rose further in August. M2 increased to 2.0% y/y (2.1% in July), while M3 rose 1.2% y/y (1.3% in July). M1 eased to 0.7% y/y from 1.2%, while broad liquidity L slowed to 1.9% y/y from 2.1%. Average outstanding balances were broadly stable: M2 at ¥1.296qn and M3 at ¥1.640qn. Within broad liquidity, growth in investment trusts and bank-issued securities remained firm, while currency circulation and deposit money grew more slowly. Nikkei -0.19% to 65143, USDJPY +0.692% to 153.18, 10y JGB -1.5bp to 2.885%.
Japan’s preliminary order data for August showed total orders of ¥197.880bn, up 2.5% m/m and 64.7% y/y. Domestic demand was ¥51.533bn, down 3.2% m/m but up 61.6% y/y. External demand reached ¥146.347bn, rising 4.6% m/m and 65.8% y/y. For 2026 YTD, total orders were ¥1.446tn, up 40.9% y/y, supported by both domestic and external demand. The figures indicate broad-based annual strength, with external orders remaining the main driver.
Chinese CPI rose 0.8% y/y and 0.4% m/m in August, with the January-August average up 0.9% y/y. Food prices fell 1.4% y/y, while non-food prices rose 1.2%; consumer goods and services both increased by 0.8% y/y. On a m/m basis, food rose 0.4%, led by fresh vegetables (+5.5%) and eggs (+2.0%), while fresh fruit (-2.5%) and water products (-0.9%) weighed on prices. In the y/y breakdown, pork remained a major drag, down 11.8%, alongside lower vegetable and dairy prices, partly offset by higher egg prices (+15.0%). Among non-food items, transport and communication rose 2.5% y/y, reflecting higher transport fuel and communication equipment costs, while housing dipped 0.3% y/y. Core inflation excluding food and energy rose 1.0% y/y, which suggests modest underlying price pressure. CSI 300 +0.3% to 4573, USDCNY +0.044% to 6.7073, 10y CGB -0.7bp to 1.68%.
China’s producer price index for August showed a broad-based uptick. PPI rose 3.8% y/y (3.8% in July) and 0.4% m/m (0.4% in July), while producer purchase prices increased by 5.8% y/y and 0.3% m/m. For January-August, PPI averaged 2.0% above year-earlier levels and purchase prices were up 3.2%. The y/y rise was led by production goods (+5.0%), especially mining and raw materials, while living goods fell 0.5%, with food down 2.3% and clothing down 1.2%. On the purchase side, gains were strongest in non-ferrous metals, fuel and power, and chemicals, while building materials and farm products posted falls. On a m/m basis, higher mining and raw material prices lifted both output and input prices.
South Korea’s Economically Active Population Survey for August showed a modestly firmer labor market. The economically active population rose to 29.739 million (+180k, +0.6% y/y), while the labor force participation rate held steady at 64.6% y/y. The number of employed people increased to 29.151 million (+184k, +0.6% y/y), with the employment-to-population ratio unchanged at 63.3% y/y. The unemployment count edged down to 588k (-4k, -0.6% y/y), leaving the unemployment rate flat at 2.0% y/y or 2.7% on a seasonally adjusted basis. The economically inactive population also rose slightly to 16.297 million (+77k, +0.5% y/y). Overall, the data point to continued labor market stability with only marginal changes across key indicators. CSI 300 +0.3% to 4573, USDCNY +0.044% to 6.7073, 10y CGB -0.7bp to 1.68%.
Malaysia’s Industrial Production Index (IPI) rose 4.7% y/y in July, as the positive momentum in manufacturing continued. Growth was driven mainly by manufacturing (+6.4% y/y) and electricity (+5.0% y/y), while mining fell 3.2% y/y. On a m/m basis, IPI declined by 2.0% after rising 5.5% in June. Export-oriented manufacturing grew 6.7% y/y, supported by computer, electronics and optical products (+14.0%) and machinery and equipment (+14.6%), though it fell 3.1% m/m. Domestic-oriented industries increased by 5.8% y/y, led by basic metals and food processing. Mining weakened on lower crude oil and condensate output, while natural gas growth slowed. Across January-July, the IPI rose 5.7% y/y. KLCI -0.15% to 1712, USDMYR -0.123% to 4.0675, 10y MGB +5.3bp to 4.096%.
Malaysia’s manufacturing sector expanded in July, with sales rising 9.1% y/y and 0.2% m/m to MYR 177.3bn (June: MYR 177.0bn). Growth was led by electrical and electronics products (+17.8% y/y), supported by food, beverages and tobacco (+3.9% y/y, June: +2.2%) and petroleum, chemical, rubber and plastic (+3.6% y/y). Export-oriented industries rose 9.9% y/y and accounted for 72.2% of total sales, driven by computer, electronic and optical products (+19.0% y/y) and machinery and equipment (+17.8% y/y, June: +9.9%). Domestic-oriented industries grew 7.2% y/y. Employment increased by 1.1% y/y to 2.4 million, while salaries and wages rose 2.8% y/y to MYR 8.55bn. Cumulative sales across January-July reached MYR 1.20tn (+7.6% y/y).
Taiwanese exports, measured in USD, surged 41.0% y/y and 9.4% m/m in August to reach a record $82.4bn. Meanwhile, imports rose 44.3% y/y to $60.1bn, lifting the trade surplus to a record $22.3bn. Export growth remained heavily concentrated in technology, with electronic components up 58.0% y/y to $32.2bn and information and communications products up 41.8% to $33.1bn, together accounting for 79.3% of total exports. There were rises in shipments to the U.S (+20.7%), China and Hong Kong (+39.3%) and ASEAN (+42.2%). January-August exports increased by 44.2% y/y, supported by strong AI, high-performance computing and cloud infrastructure demand, while imports rose 40.4%. TAIEX +0.16% to 47183, USDTWD -0.149% to 31.498, 10y TGB -1bp to 1.87%.