Higher Treasury yields haven’t dented IG credit
iFlow > Investor Trends
Investor Trends provides a deep dive into patterns and behaviors in equity, bond and currency markets around the globe, underpinned with deeper macro insights.
iFlow > Investor Trends
Investor Trends provides a deep dive into patterns and behaviors in equity, bond and currency markets around the globe, underpinned with deeper macro insights.

David Tam
Time to Read: 5 minutes
Higher energy prices are creating selective opportunities rather than a broad energy trade. NOK and CAD flows have improved, but gains look tactical; institutional demand still supports energy equities despite retail profit-taking, while European duration remains more exposed than U.S. Treasurys to higher inflation premia.
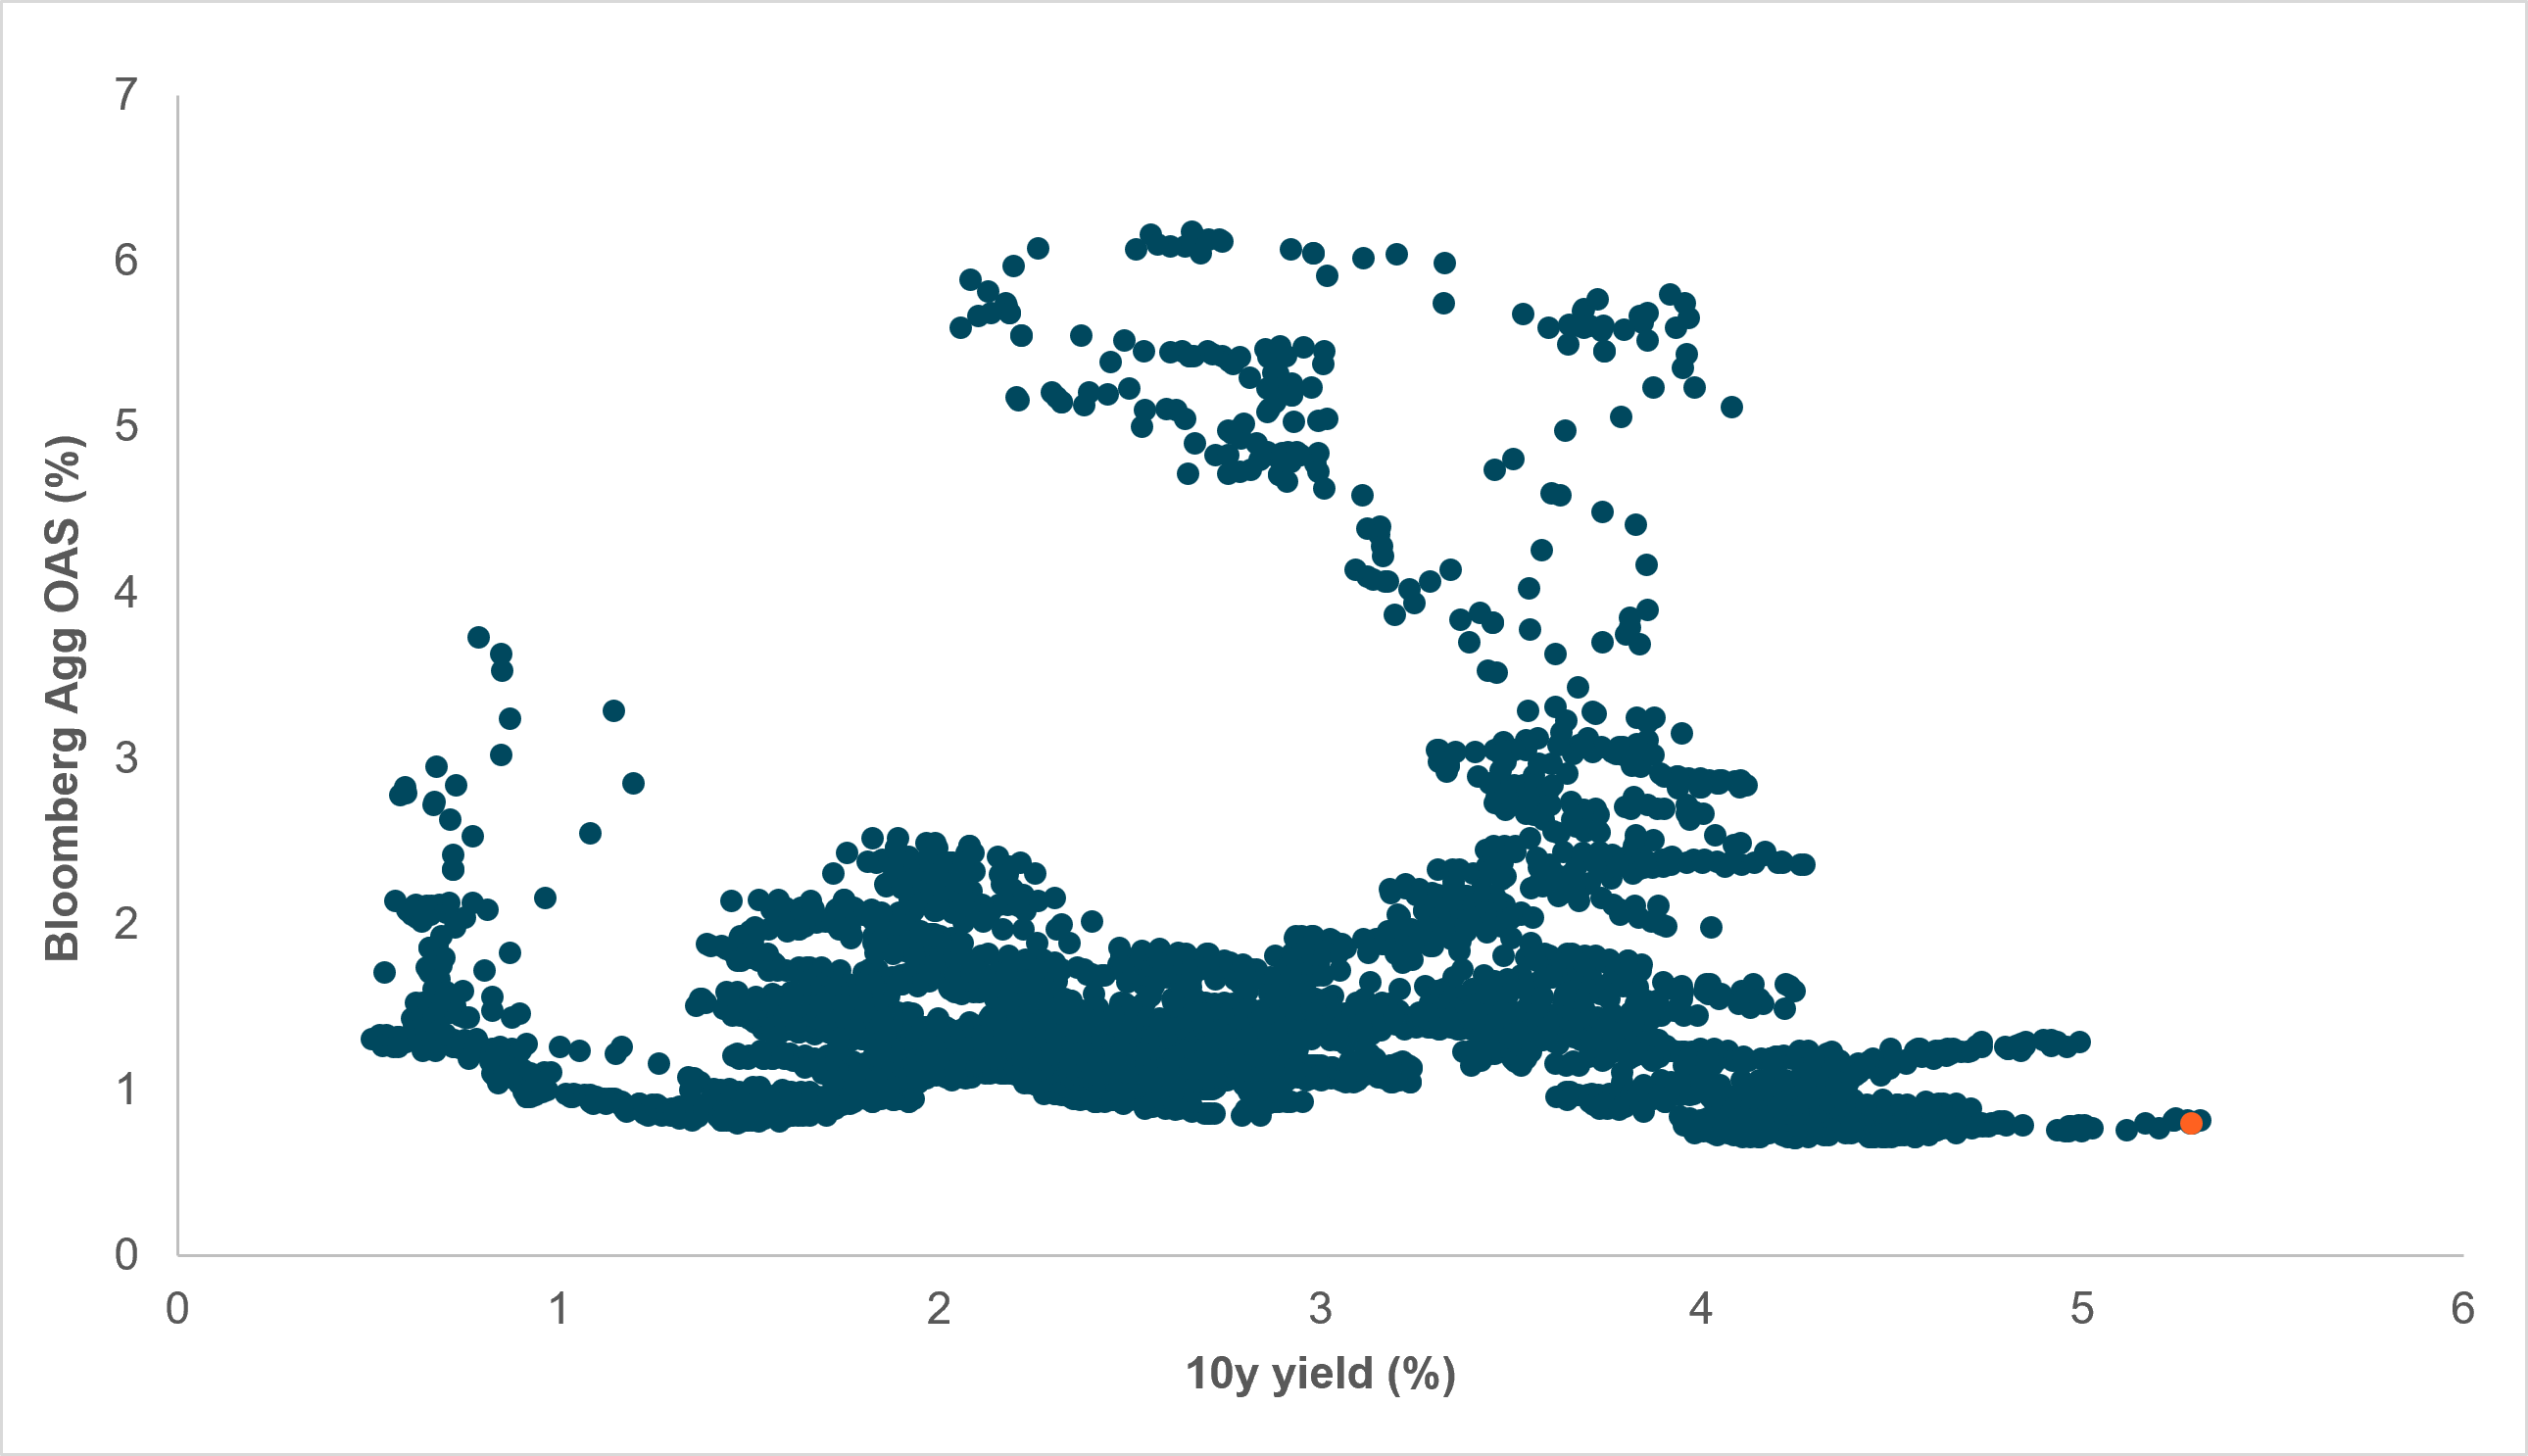
EXHIBIT #1: YIELDS AT MULTI-DECADE HIGHS, SPREADS NEAR LOWS
Source: BNY, Bloomberg
Seeming disconnect: Treasury yields have risen to their highest levels in decades. Normally, higher risk-free rates driven by the market pricing a more hawkish Fed might pressure credit spreads to widen through two main transmission mechanisms:
But IG spreads have remained very well contained. Exhibit 1 shows a scatterplot of daily observations of 10y yields and IG spreads since 2008. The orange dot in the bottom right represents the 10y treasury yield and IG credit OAS level on October 8. Even as yields have risen in recent months to their highest levels in decades, IG credit OAS is only 9bp off its post-2008 low.
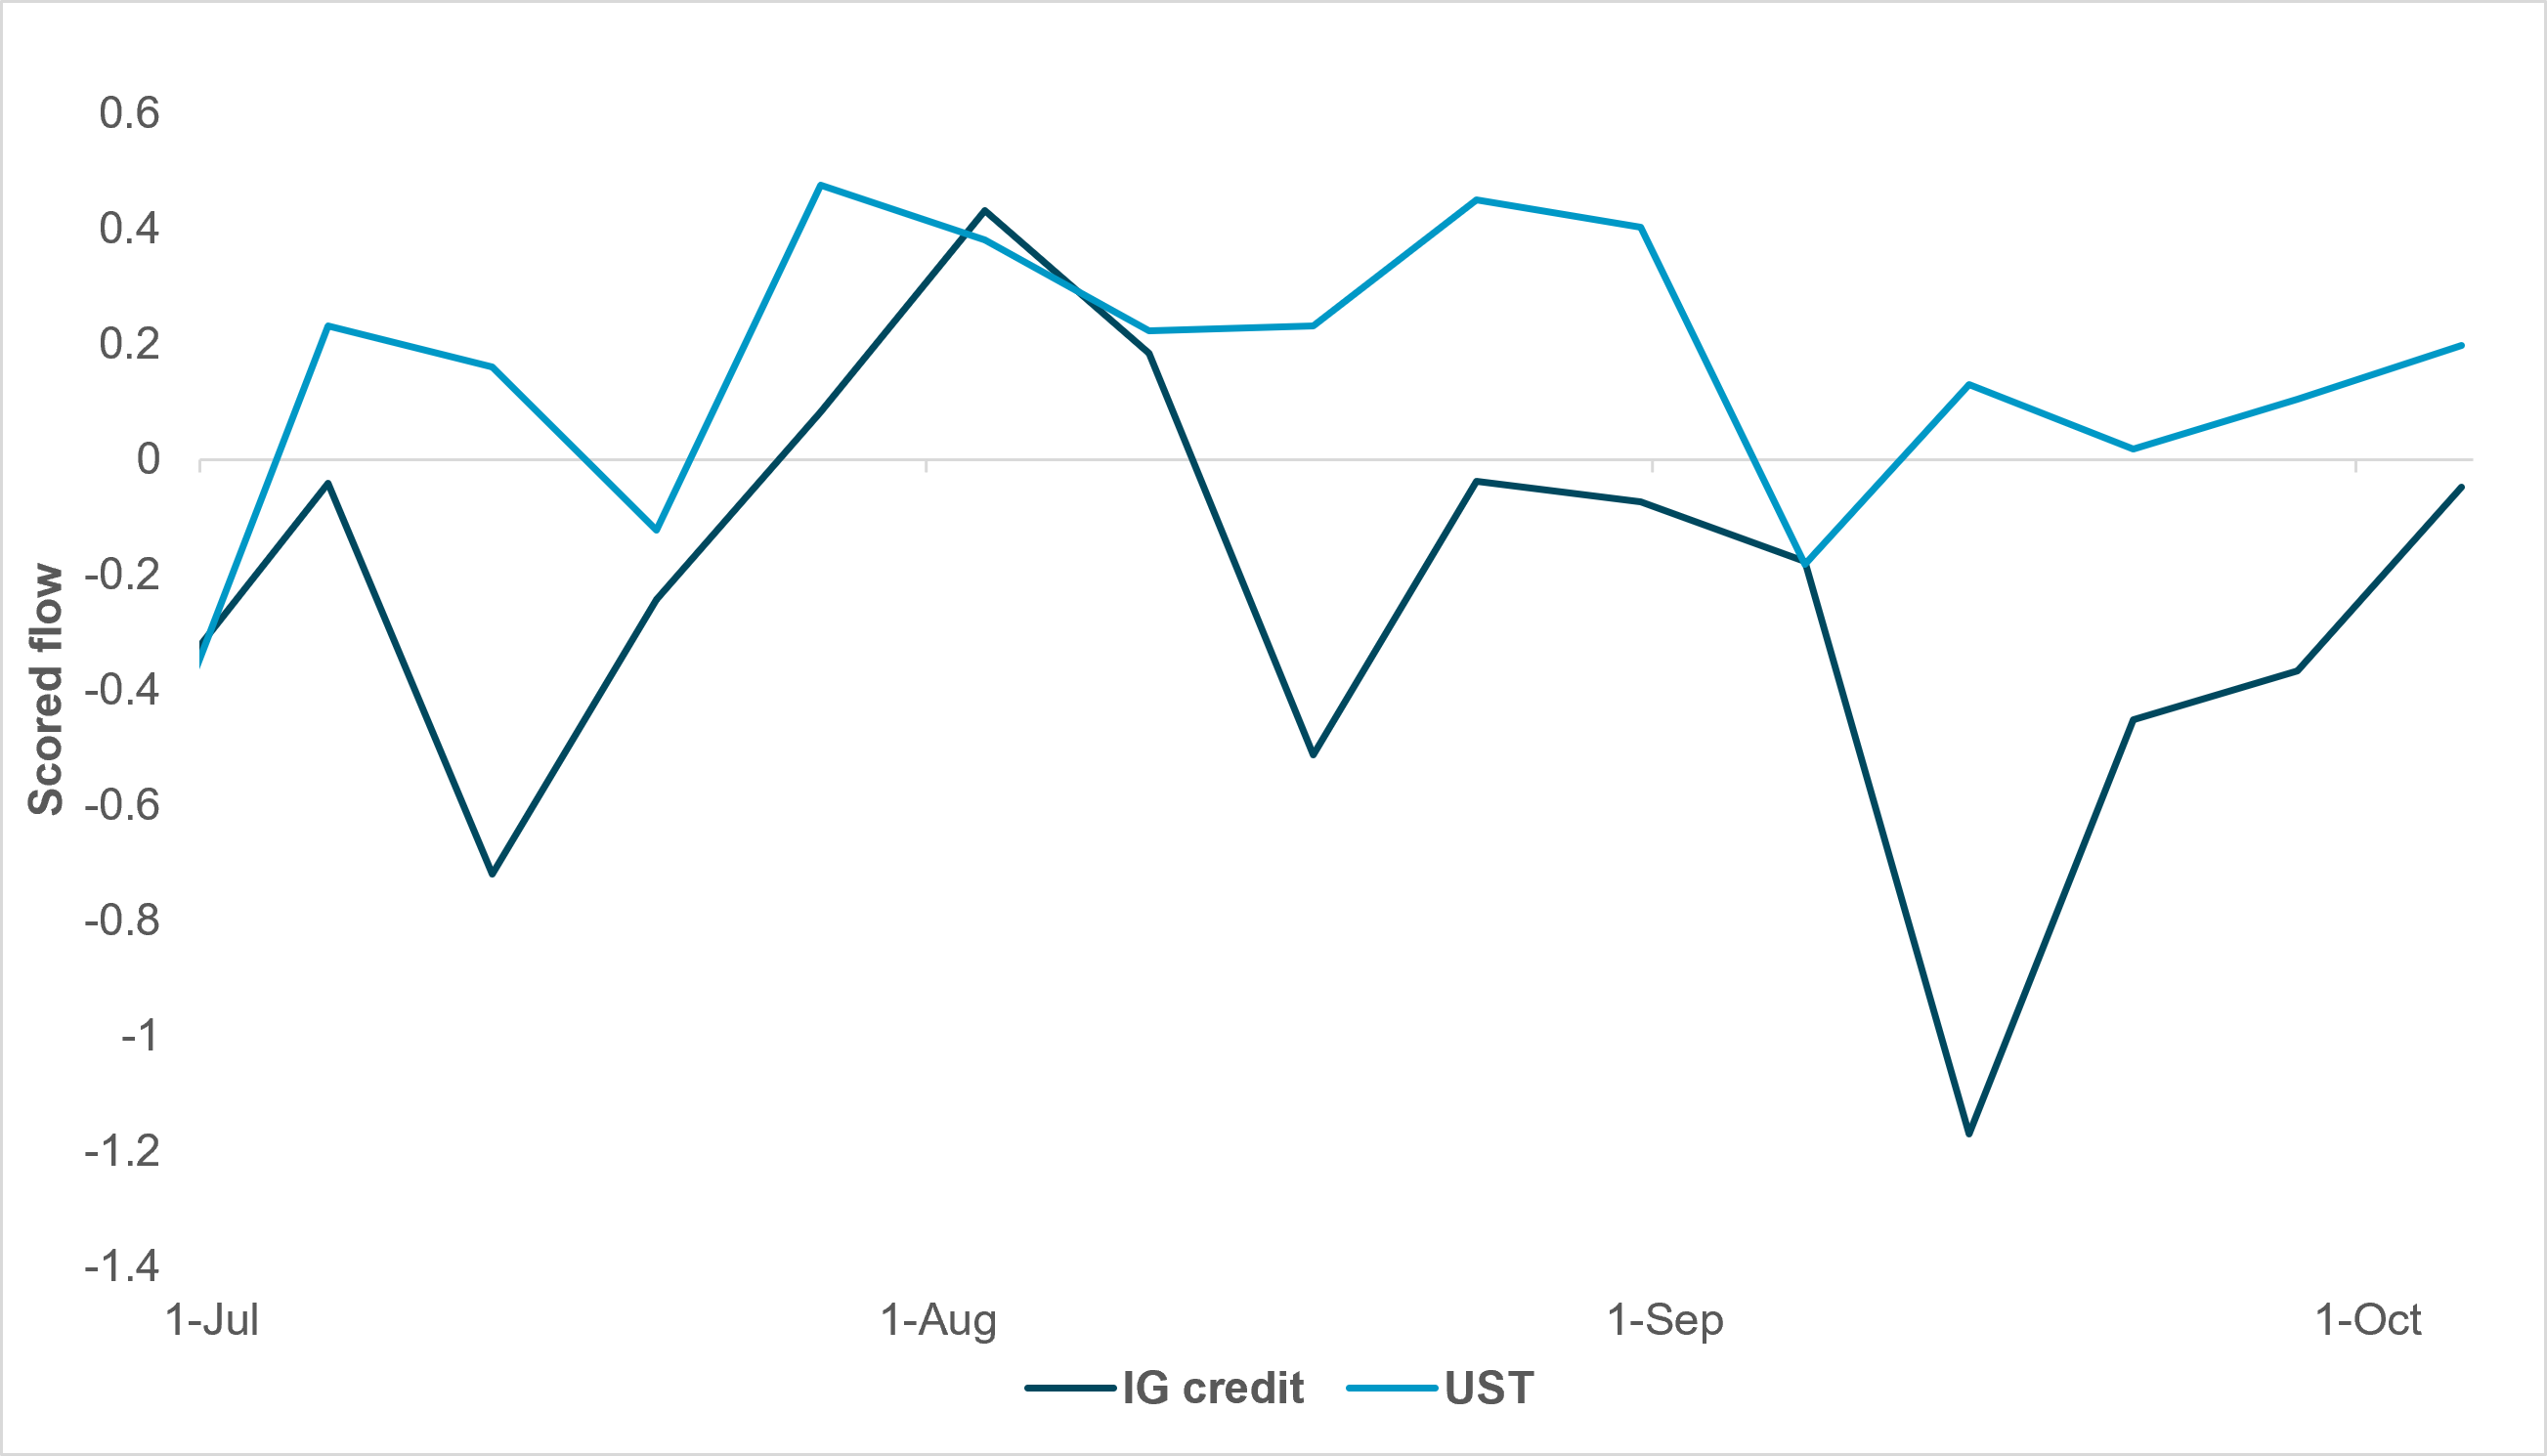
EXHIBIT #2: IG OUTFLOWS PERSIST WHILE TREASURYS DRAW INFLOWS
Source: BNY
Outflows from IG: Over Q3, investor sentiment turned negative toward IG credit with selling picking up in September before starting to recover in October (Exhibit 2). iFlow data show that IG credit saw negative scored flows, signifying outflows, for eight consecutive weeks through early October, with selling easing in the latest reading.
Over the same time frame, the spreads on the Bloomberg aggregate corporate IG index widened by only 3bp, suggesting that while the outflow streak was persistent, it was fairly orderly. Further, the market seemed to grow more discerning with IG credit spreads staying well contained while high-yield spreads widened by as many as 54bp before narrowing over the past week.
Modest inflows into Treasurys: By contrast, Exhibit 2 also shows that Treasurys have enjoyed consistent though modest inflows throughout the quarter, with only two weeks of outflows since the end of June. Far from suggesting an aversion to Treasurys, the rising yield environment has provided investors an opportunity to tactically add to positions at a more attractive entry point.
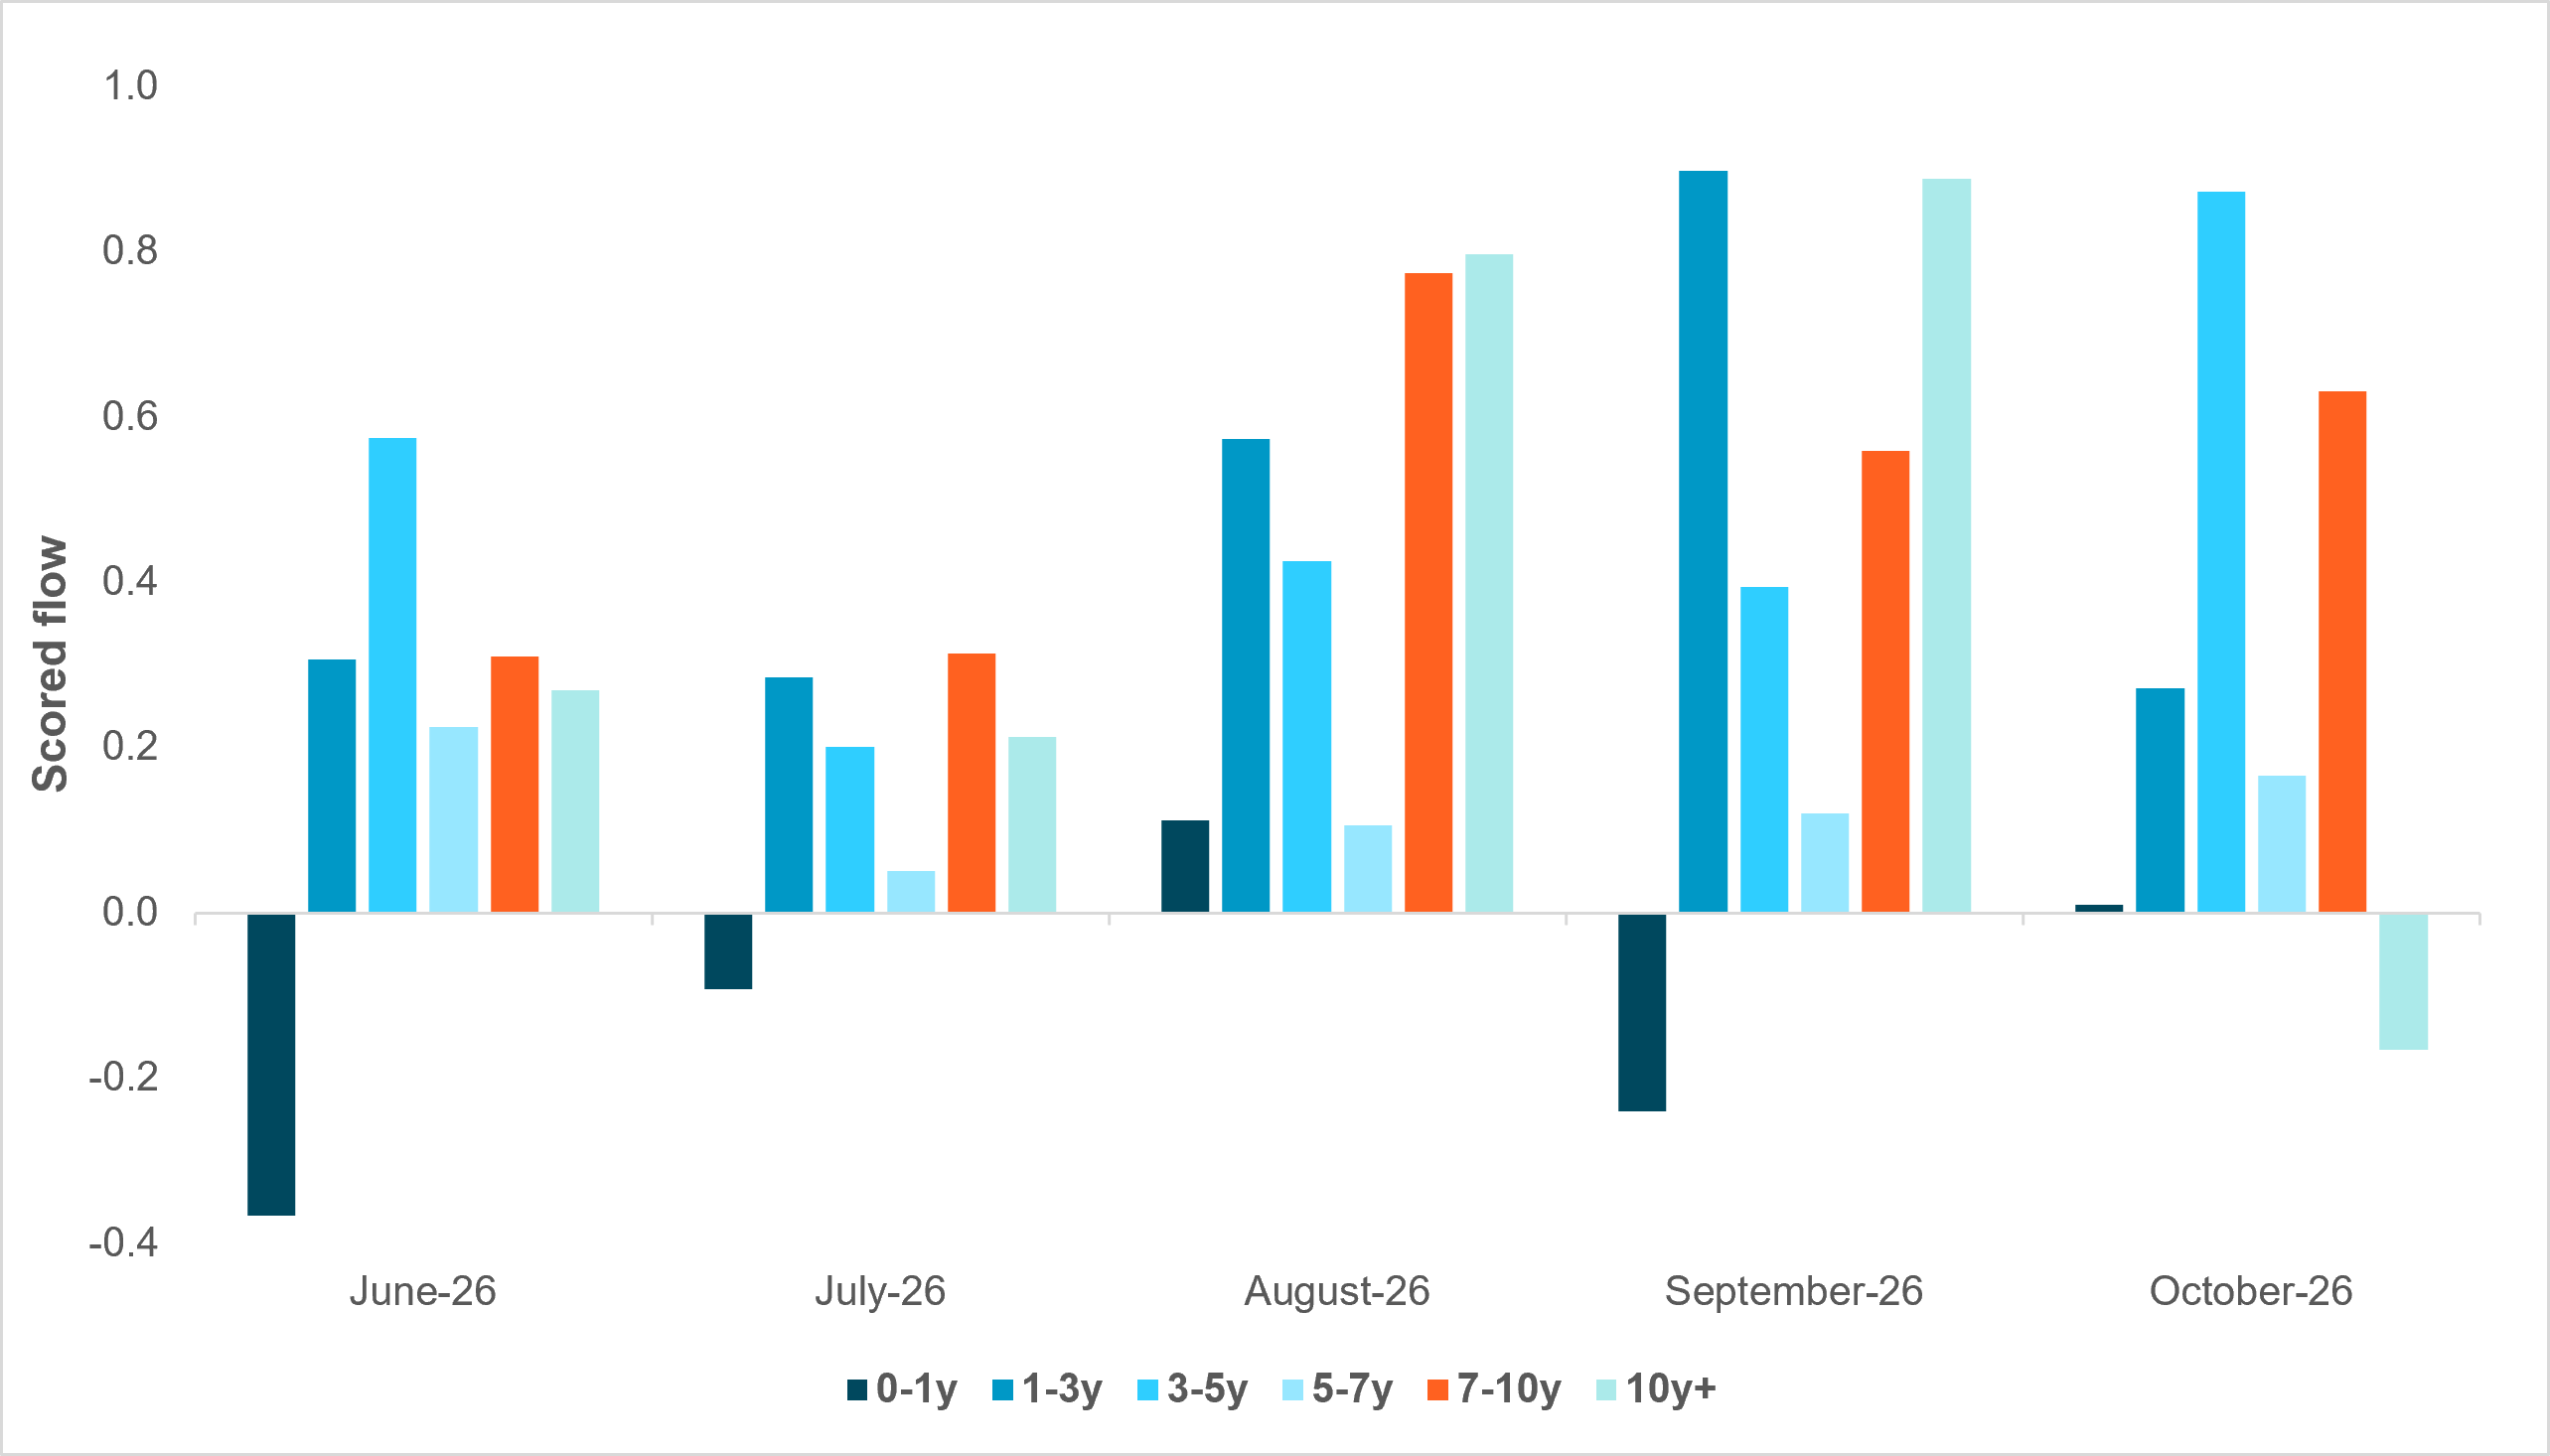
EXHIBIT #3: DURATION DRAWS INFLOWS WHILE BILLS LAG
Source: BNY
Demand for duration: Monthly flows into Treasurys have been broad based. The 1-3y, 3-5y, 5-7y and 7-10y sectors all saw inflows every month since June (Exhibit 3). Long-dated Treasurys (10y and greater to maturity) saw persistent inflows through the summer, and on a scored basis led all sectors in August and performed well in September before swinging to modest outflows in October.
Muted bill demand: By contrast, investor demand for bills was tepid with outflows in June, July and September and only very modest inflows in August and October. It’s puzzling that investors sought out duration and rejected bills given the backdrop of gradual hawkish repricing of the Fed path over the summer. One might expect a hawkish repricing to lead to net selling of the long-end due to its greater duration sensitivity.
Higher for shorter: However, the fact that we’ve seen inflows into intermediate and longer-dated Treasurys could suggest that investors view the Fed’s hawkish move as likely to be short-lived. If the rise in yields is motivated in part by confidence in the Fed’s credibility to hike and get inflation under control, then investors might be expecting that the Fed won’t need to keep rates in restrictive territory for too long.
Attractive yields for LDIs: The rise in yields may also have been sufficiently large to trigger pension, insurance and other liability-matching demand. iFlow data show that pension funds and insurers collectively extended their duration, increasing their long-end Treasury holdings by over $30bn in Q3. At the same time, pension and insurance fund holdings of IG credit declined by over $90bn. These investors need not necessarily be calling the peak in Treasurys; they simply might be regarding the long end as more attractive compared to their own long-term liabilities, and within that, favoring investments with no credit exposure.
Support for Treasurys: If Treasury yields continue to rise while IG spreads hold, we should expect a marginal additional incentive to rotate out of IG and into Treasurys. Over time, this should be supportive of Treasurys and might lead IG credit spreads to widen.
Limits to the rotation: Investors may care less about whether spreads are tight in historical percentile terms if the outright yield exceeds return targets. This is particularly true if they feel as if a recession or credit deterioration aren’t imminent, in which case investors may be happy to accept tight spreads to capture the incremental income.
High benchmark Treasury weight: Another aspect that may eventually limit the rotation out of IG into Treasurys is that many benchmarks are already fairly saturated with Treasury exposure. Treasurys make up nearly half of the Bloomberg Aggregate Bond Index, for example, and the share is similar for other large ETFs and benchmarks. Furthermore, this share has risen meaningfully over the past five years, reflecting the growth in Treasury issuance relative to other components. This limits the capacity for further rotation into Treasurys as many benchmark-tracking investors already have a high allocation to Treasurys, leaving less room for marginal increases in their Treasury positions at the expense of credit.
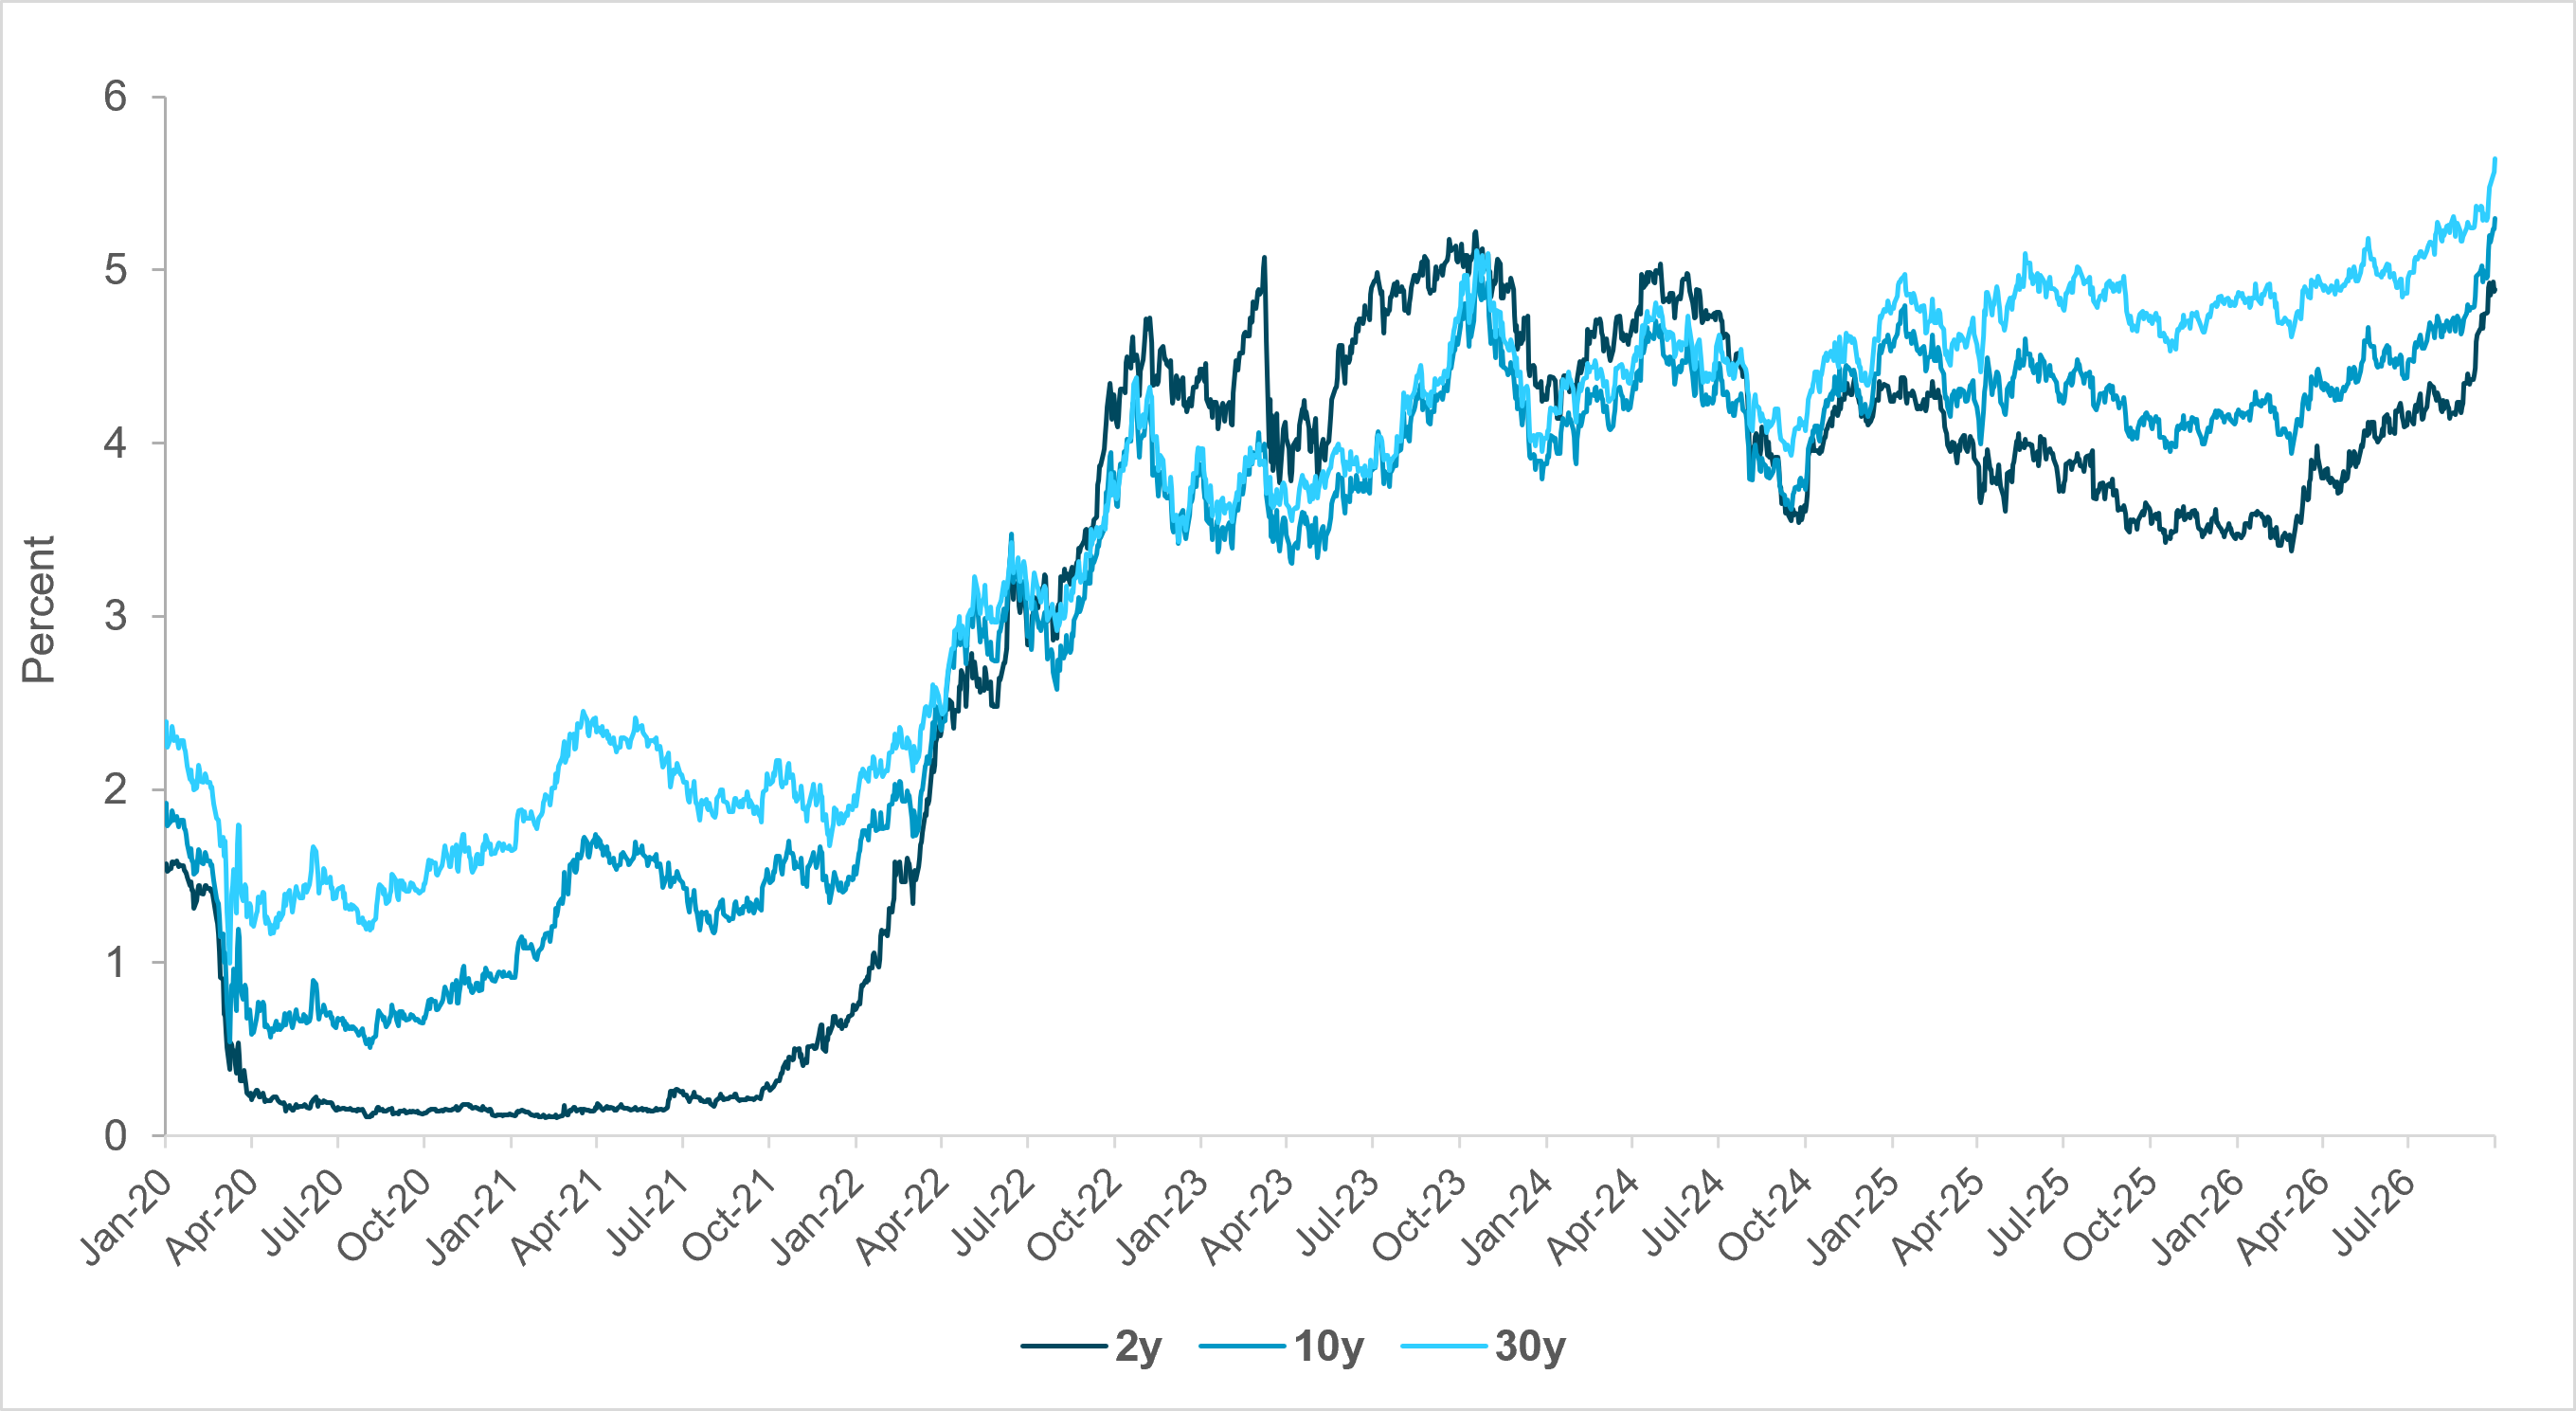
EXHIBIT #4: TREASURY YIELDS CLIMB ACROSS THE CURVE
Source: Bloomberg
Fixed income as a growing pie: All-in yields across fixed income are growing more attractive as they’re generally priced off of a Treasury base that’s rising (Exhibit 4). This should entice inflows into multiple fixed income asset classes at once, as cash on the sidelines hunts for yield and equity investors concerned with stretched valuations seek out safety. Treasurys growing more appealing needn’t come at the expense of IG, as new money enters fixed income and spreads can remain tight if the asset class as a whole grows more appealing.